Slark Signal - Telegram Alert---
Indicator Description: Slark Signal - Telegram Alert
The Slark Signal - Telegram Alert is a custom trading indicator designed to detect potential buy and sell signals based on pivots and trendlines. This indicator sends real-time alerts via Telegram when specific market conditions are met and provides automatic Stop-Loss (SL) and Take-Profit (TP) levels for better trade management.
---
What Does the Indicator Do?
Pivot-Based Signals: Detects significant pivot highs and lows to identify potential trend reversals.
Automatic SL and TP Levels: Projects customizable Stop-Loss and Take-Profit levels on the chart based on user-defined parameters.
Telegram Alerts: Sends buy or sell signals with relevant trade details (entry price, SL, and TP) to your Telegram channel when conditions are met.
Session-Based Signals: Limits the signals to a specific trading session (8:00 - 10:00).
---
How Does the Indicator Work?
Customizable Input Parameters:
- Pivot Detection Length: Defines the length used to detect pivot highs and lows.
- Slope Multiplier: Controls the slope of trendlines based on ATR.
- Session Start and End Hours: Specifies the time window during which signals can be generated.
- SL and TP Ticks: Defines the distance (in ticks) for Stop-Loss and Take-Profit levels.
- Telegram Chat ID: Input your Telegram chat ID to receive alerts in your Telegram channel.
Pivot Highs and Lows Detection:
- The indicator calculates pivot highs (PH) and pivot lows (PL) over the specified period, drawing trendlines for both based on the slope multiplier.
- Trendline Breakouts: When the price crosses above the upper trendline or below the lower trendline, it generates a buy or sell signal.
Signal Generation and Trade Levels:
- If a buy signal is detected, the indicator automatically sets and displays the entry price, Stop-Loss, and Take-Profit levels.
- The same applies for sell signals when a sell condition is met.
- Signals are valid only within the defined trading session (8:00 - 10:00).
Telegram Alerts:
- When a buy or sell signal is triggered, an alert with the trade details (entry price, SL, and TP) is sent to your Telegram chat via the chat ID you have provided.
---
How to Use the Indicator?
Set Up Input Parameters:
- Pivot Detection Length: Set the period for detecting pivot highs and lows (default: 5).
- Slope Multiplier: Adjust the slope multiplier for trendlines based on ATR (default: 0.4).
- SL and TP Ticks: Define the tick distance for SL and TP (default: SL = 100, TP = 300).
- Session Start and End Hours: Set the time window for signal generation (default: 8:00 - 10:00).
- Telegram Chat ID: Input your Telegram channel’s chat ID to receive alerts.
Interpreting Buy and Sell Signals:
- Buy Signal: When a buy condition is met, a label "COMPRA" is shown below the bar, and the system sends the signal to Telegram with all trade details.
- Sell Signal: When a sell condition is met, a label "VENTA" is displayed above the bar, and the system sends the corresponding alert to Telegram.
- The system ensures signals are only triggered during the defined session time (8:00 - 10:00).
Trade Planning and Risk Management:
- **Stop-Loss and Take-Profit:** Automatically drawn on the chart, use these levels to plan your trades.
- **Telegram Alerts:** Stay updated with real-time buy or sell signals in your Telegram channel for quick decision-making.
---
What Makes This Indicator Original?
Pivot and Trendline Logic: The indicator uses pivot highs and lows to draw dynamic trendlines, identifying key reversal points and breakouts.
Real-Time Telegram Alerts: Unique in its ability to send automatic alerts with detailed trade information directly to your Telegram channel, allowing you to act quickly on signals.
Built-In SL/TP Visualization: The system automatically calculates and displays SL and TP levels, making it easier to manage risk and reward.
Session-Based Signals: Helps traders focus on key trading hours by limiting signal generation to a specific time range.
---
Additional Considerations
Complement with Other Analysis: It is recommended to use this indicator in conjunction with other analysis tools to confirm trade setups.
Testing: Before using the indicator live, consider testing it on a demo account to fine-tune your settings.
Risk Management: Ensure that the SL and TP levels fit your trading strategy and risk tolerance.
Market Awareness: Stay informed about news and events that could impact market conditions during your trading session.
---
Example Configuration
To help you get started, here is an example configuration:
Pivot Detection Length: 5
Slope Multiplier: 0.4
SL Ticks: 100
TP Ticks: 300
Session Start Hour: 8
Session End Hour: 10
Telegram Chat ID: Input your unique Telegram chat ID here.
---
Conclusion
The Slark Signal - Telegram Alert indicator provides a highly customizable and automated solution for detecting buy and sell signals based on pivots and trendline breaks. By utilizing real-time alerts via Telegram, you can stay updated on key trading opportunities. It also offers automatic SL and TP levels, making trade planning and risk management straightforward.
Ready for immediate use in TradingView, this indicator can become a vital part of your trading strategy.
---
In den Scripts nach "take profit" suchen

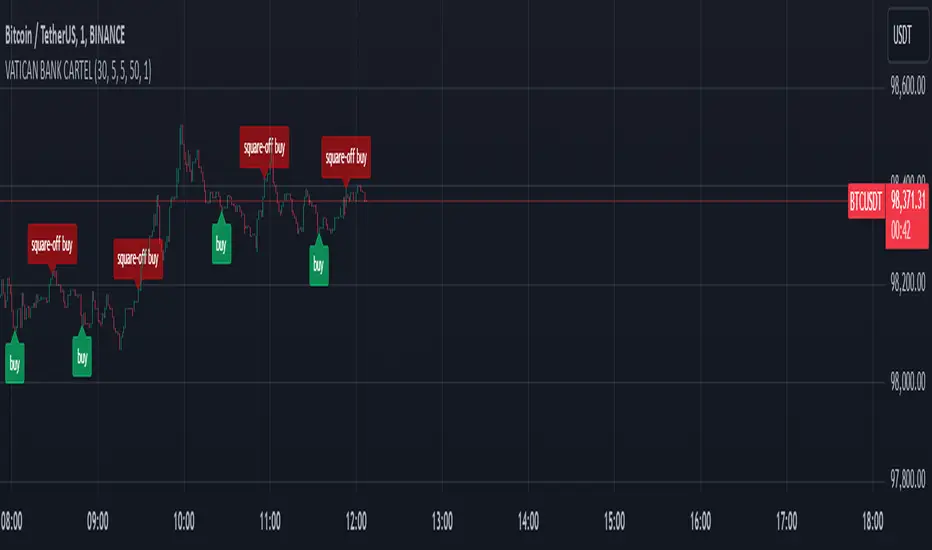
VATICAN BANK CARTELVATICAN BANK CARTEL - Precision Signal Detection for Buyers.
The VATICAN BANK CARTEL indicator is a highly sophisticated tool designed specifically for buyers, helping them identify key market trends and generate actionable buy signals. Utilizing advanced algorithms, this indicator employs a multi-variable detection mechanism that dynamically adapts to price movements, offering real-time insights to assist in executing profitable buy trades. This indicator is optimized solely for identifying buying opportunities, ensuring that traders are equipped to make well-timed entries and exits, without signals for shorting or selling.
The recommended settings for VATICAN BANK CARTEL indicator is as follows:-
Depth Engine = 20,30,40,50,100.
Deviation Engine = 3,5,7,15,20.
Backstep Engine = 15,17,20,25.
NOTE:- But you can also use this indicator as per your setting, whichever setting gives you best results use that setting.
Key Features:
1.Adaptive Depth, Deviation, and Backstep Inputs:
The core of this indicator is its customizable Depth Engine, Deviation Engine, and Backstep Engine parameters. These inputs allow traders to adjust the sensitivity of the trend detection algorithm based on specific market conditions:
Depth: Defines how deep the indicator scans historical price data for potential trend reversals.
Deviation: Determines the minimum required price fluctuation to confirm a market movement.
Backstep: Sets the retracement level to filter false signals and maintain the accuracy of trend detection.
2. Visual Signal Representation:
The VATICAN BANK CARTEL plots highly visible labels on the chart to mark trend reversals. These labels are customizable in terms of size and transparency, ensuring clarity in various chart environments. Traders can quickly spot buying opportunities with green labels and potential square-off points with red labels, focusing exclusively on buy-side signals.
3.Real-Time Alerts:
The indicator is equipped with real-time alert conditions to notify traders of significant buy or square-off buy signals. These alerts, which are triggered based on the indicator’s internal signal logic, ensure that traders never miss a critical market movement on the buy side.
4.Custom Label Size and Transparency:
To enhance visual flexibility, the indicator allows the user to adjust label size (from small to large) and transparency levels. This feature provides a clean, adaptable view suited for different charting styles and timeframes.
How It Works:
The VATICAN BANK CARTEL analyzes the price action using a sophisticated algorithm that considers historical low and high points, dynamically detecting directional changes. When a change in market direction is detected, the indicator plots a label at the key reversal points, helping traders confirm potential entry points:
- Buy Signal (Green): Indicates potential buying opportunities based on a trend reversal.
- Square-Off Buy Signal (Red): Marks the exit point for open buy positions, allowing traders to take profits or protect capital from potential market reversals.
Note: This indicator is exclusively designed to provide signals for buyers. It does not generate sell or short signals, making it ideal for traders focused solely on identifying optimal buying opportunities in the market.
Customizable Parameters:
- Depth Engine: Fine-tunes the historical data analysis for signal generation.
- Deviation Engine: Adjusts the minimum price change required for detecting trends.
- Backstep Engine: Controls the indicator's sensitivity to retracements, minimizing false signals.
- Labels Transparency: Adjusts the opacity of the labels, ensuring they integrate seamlessly into any chart layout.
- Buy and Sell Colors: Customizable color options for buy and square-off buy labels to match your preferred color scheme.
- Label Size: Select between five different label sizes for optimal chart visibility.
Ideal For:
This indicator is ideal for both beginner and experienced traders looking to enhance their buying strategy with a highly reliable, visual, and alert-driven tool. The VATICAN BANK CARTEL adapts to various timeframes, making it suitable for day traders, swing traders, and long-term investors alike—focused exclusively on buying opportunities.
Benefits and Applications:
1.Intraday Trading: The VATICAN BANK CARTEL indicator is particularly well-suited for intraday trading, as it provides accurate and timely "buy" and "square-off buy" signals based on the current market dynamics.
2.Trend-following Strategies: Traders who employ trend-following strategies can leverage the indicator's ability to identify the overall market direction, allowing them to align their trades with the dominant trend.
3.Swing Trading: The dynamic price tracking and signal generation capabilities of the indicator can be beneficial for swing traders, who aim to capture medium-term price movements.
Security Measures:
1. The code includes a security notice at the beginning, indicating that it is subject to the Mozilla Public License 2.0, which is a reputable open-source license.
2. The code does not appear to contain any obvious security vulnerabilities or malicious content that could compromise user data or accounts.
NOTE:- This indicator is provided under the Mozilla Public License 2.0 and is subject to its terms and conditions.
Disclaimer: The usage of VATICAN BANK CARTEL indicator might or might not contribute to your trading capital(money) profits and losses and the author is not responsible for the same.
IMPORTANT NOTICE:
While the indicator aims to provide reliable "buy" and "square-off buy" signals, it is crucial to understand that the market can be influenced by unpredictable events, such as natural disasters, political unrest, changes in monetary policies, or economic crises. These unforeseen situations may occasionally lead to false signals generated by the VATICAN BANK CARTEL indicator.
Users should exercise caution and diligence when relying on the indicator's signals, as the market's behavior can be unpredictable, and external factors may impact the accuracy of the signals. It is recommended to thoroughly backtest the indicator's performance in various market conditions and to use it as one of the many tools in a comprehensive trading strategy, rather than solely relying on its output.
Ultimately, the success of the VATICAN BANK CARTEL indicator will depend on the user's ability to adapt it to their specific trading style, market conditions, and risk management approach. Continuous monitoring, analysis, and adjustment of the indicator's settings may be necessary to maintain its effectiveness in the ever-evolving financial markets.
DEVELOPER:- yashgode9
PineScript:- version:- 5
This indicator aims to enhance trading decision-making by combining DEPTH, DEVIATION, BACKSTEP with custom signal generation, offering a comprehensive tool for traders seeking clear "buy" and "square-off buy" signals on the TradingView platform.
legend fox concepts reversal 2.0
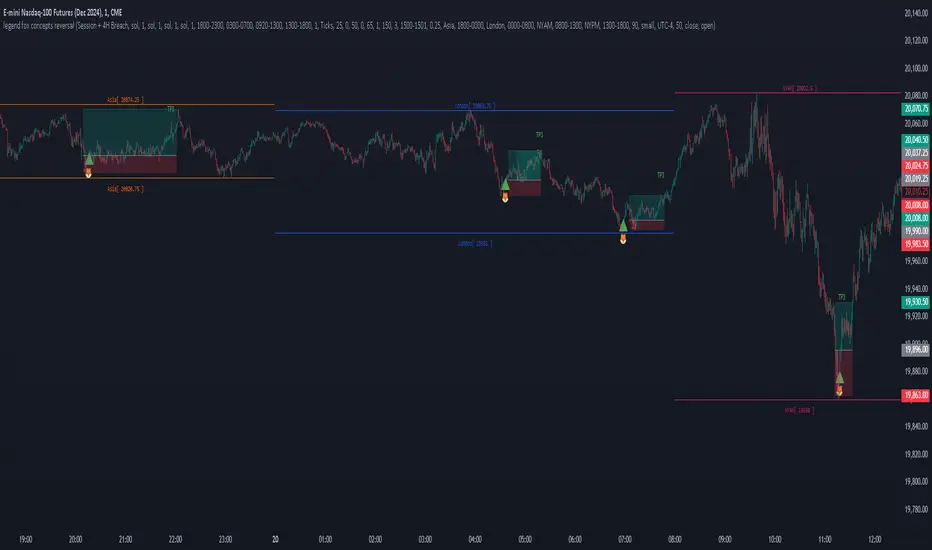
The Legend Fox Concepts Reversal is a comprehensive tool that integrates multiple trading elements, including Trading Sessions, Previous Daily and 4-Hour Levels, and the Imbalance Concept, into a single system designed to help traders identify potential reversal points. The indicator visually highlights these opportunities by generating clear signals, such as green arrows for bullish setups and red arrows for bearish setups. It is particularly effective when applied on shorter timeframes and works best in conjunction with trading futures products, helping traders anticipate market turning points with greater precision.
The indicator is comprised of four essential components, each designed to enhance the trader’s experience and adaptability:
1. Preset Method:
◦ Includes presets that plot Previous Daily and 4-Hour High/Low Levels on the chart, visually distinguished by orange and yellow colors. These levels can be configured in four distinct combinations to suit various trading styles, helping users identify key support and resistance zones. Traders have the option to enable or disable these levels based on their strategy, offering enhanced flexibility and clarity for analyzing potential price reactions.
2. Time Parameters:
◦ Allows users to define specific trading hours based on different financial market sessions worldwide. This component is segmented into four distinct parts, enabling users to customize session times to align with their preferred trading windows. Each segment is color-coded for visual clarity and can be independently enabled or disabled, offering precision in tracking session-specific price action and highlighting relevant market activity.
3. Profit Method:
◦ Supports up to four target price levels, defined in either Ticks or Standard Deviations. This feature is especially useful when trading multiple contracts, allowing for a structured approach to taking profits. Users can customize settings such as Distribution Width, Source of Mean, and Price Reference to standard deviations, tailoring the take-profit strategy to fit unique trading goals.
4. Imbalance Setup:
◦ Refers to the size of gaps between candles, an important factor in anticipating potential reversal signals. Depicted as gray for bullish and blue for bearish imbalances, users can modify the gap width, helping to fine-tune the timing of signals to detect reversals earlier or later depending on market conditions.
Use Case:
• Trading Session Setup:
The trading session is defined by the user as Asia (represented by yellow lines on the chart, with time set between 18:00 - 24:00) and London (depicted by blue lines, with time set between 24:00 - 7:00). This segmentation helps to visually differentiate and track the activity within each session.
• Daily Breach preset:
Next, the Daily Breach preset is applied by enabling the Previous Daily Candle High and Low levels to be displayed on the chart (marked by orange dashed lines). These levels serve as key reference points for potential breakouts or reversals.
• Contract Allocation and Take Profit Setup:
We have input the number of contracts to trade: using 4 contracts for the NQ (Nasdaq Futures). The take-profit levels are defined using ticks. For example, once TP1 is reached at 50 ticks, 2 contracts are closed, leaving the remaining 2 contracts to be closed at TP2, which is set at 100 ticks.
• No Trade Signal Detected:
In this instance, price did not hit any of the Previous Daily High or Low levels, so no trade signal was generated.
• Price Action During the London Session:
Price rallied during the London session, forming bullish imbalances marked by blue areas. It then hit a Previous Daily Level, reversed, and crossed back through the bullish imbalance, indicating a potential reversal. A sell signal was generated, shown as a red arrow, along with a pre-determined stop-loss and two take-profit levels. Additionally, a red dot below indicated a possible downward reversal.
• Successful Take Profit Execution:
Price reached both Target Price 1 and Target Price 2, completing the trade as expected.
By seamlessly integrating these components, the tool empowers users to customize their trading strategies by combining different elements to create unique setups that suit their individual trading styles. Additionally, various presets are available, along with comprehensive guidance on how to leverage the tool to its fullest potential.
Mean Reversion Cloud (Ornstein-Uhlenbeck) // AlgoFyreThe Mean Reversion Cloud (Ornstein-Uhlenbeck) indicator detects mean-reversion opportunities by applying the Ornstein-Uhlenbeck process. It calculates a dynamic mean using an Exponential Weighted Moving Average, surrounded by volatility bands, signaling potential buy/sell points when prices deviate.
TABLE OF CONTENTS
🔶 ORIGINALITY
🔸Adaptive Mean Calculation
🔸Volatility-Based Cloud
🔸Speed of Reversion (θ)
🔶 FUNCTIONALITY
🔸Dynamic Mean and Volatility Bands
🞘 How it works
🞘 How to calculate
🞘 Code extract
🔸Visualization via Table and Plotshapes
🞘 Table Overview
🞘 Plotshapes Explanation
🞘 Code extract
🔶 INSTRUCTIONS
🔸Step-by-Step Guidelines
🞘 Setting Up the Indicator
🞘 Understanding What to Look For on the Chart
🞘 Possible Entry Signals
🞘 Possible Take Profit Strategies
🞘 Possible Stop-Loss Levels
🞘 Additional Tips
🔸Customize settings
🔶 CONCLUSION
▅▅▅▅▅▅▅▅▅▅▅▅▅▅▅▅▅▅▅▅▅▅▅▅▅▅▅▅▅▅▅▅▅▅▅▅▅▅▅▅▅▅▅▅▅▅
🔶 ORIGINALITY The Mean Reversion Cloud (Ornstein-Uhlenbeck) is a unique indicator that applies the Ornstein-Uhlenbeck stochastic process to identify mean-reverting behavior in asset prices. Unlike traditional moving average-based indicators, this model uses an Exponentially Weighted Moving Average (EWMA) to calculate the long-term mean, dynamically adjusting to recent price movements while still considering all historical data. It also incorporates volatility bands, providing a "cloud" that visually highlights overbought or oversold conditions. By calculating the speed of mean reversion (θ) through the autocorrelation of log returns, this indicator offers traders a more nuanced and mathematically robust tool for identifying mean-reversion opportunities. These innovations make it especially useful for markets that exhibit range-bound characteristics, offering timely buy and sell signals based on statistical deviations from the mean.
🔸Adaptive Mean Calculation Traditional MA indicators use fixed lengths, which can lead to lagging signals or over-sensitivity in volatile markets. The Mean Reversion Cloud uses an Exponentially Weighted Moving Average (EWMA), which adapts to price movements by dynamically adjusting its calculation, offering a more responsive mean.
🔸Volatility-Based Cloud Unlike simple moving averages that only plot a single line, the Mean Reversion Cloud surrounds the dynamic mean with volatility bands. These bands, based on standard deviations, provide traders with a visual cue of when prices are statistically likely to revert, highlighting potential reversal zones.
🔸Speed of Reversion (θ) The indicator goes beyond price averages by calculating the speed at which the price reverts to the mean (θ), using the autocorrelation of log returns. This gives traders an additional tool for estimating the likelihood and timing of mean reversion, making the signals more reliable in practice.
🔶 FUNCTIONALITY The Mean Reversion Cloud (Ornstein-Uhlenbeck) indicator is designed to detect potential mean-reversion opportunities in asset prices by applying the Ornstein-Uhlenbeck stochastic process. It calculates a dynamic mean through the Exponentially Weighted Moving Average (EWMA) and plots volatility bands based on the standard deviation of the asset's price over a specified period. These bands create a "cloud" that represents expected price fluctuations, helping traders to identify overbought or oversold conditions. By calculating the speed of reversion (θ) from the autocorrelation of log returns, the indicator offers a more refined way of assessing how quickly prices may revert to the mean. Additionally, the inclusion of volatility provides a comprehensive view of market conditions, allowing for more accurate buy and sell signals.
Let's dive into the details:
🔸Dynamic Mean and Volatility Bands The dynamic mean (μ) is calculated using the EWMA, giving more weight to recent prices but considering all historical data. This process closely resembles the Ornstein-Uhlenbeck (OU) process, which models the tendency of a stochastic variable (such as price) to revert to its mean over time. Volatility bands are plotted around the mean using standard deviation, forming the "cloud" that signals overbought or oversold conditions. The cloud adapts dynamically to price fluctuations and market volatility, making it a versatile tool for mean-reversion strategies. 🞘 How it works Step one: Calculate the dynamic mean (μ) The Ornstein-Uhlenbeck process describes how a variable, such as an asset's price, tends to revert to a long-term mean while subject to random fluctuations. In this indicator, the EWMA is used to compute the dynamic mean (μ), mimicking the mean-reverting behavior of the OU process. Use the EWMA formula to compute a weighted mean that adjusts to recent price movements. Assign exponentially decreasing weights to older data while giving more emphasis to current prices. Step two: Plot volatility bands Calculate the standard deviation of the price over a user-defined period to determine market volatility. Position the upper and lower bands around the mean by adding and subtracting a multiple of the standard deviation. 🞘 How to calculate Exponential Weighted Moving Average (EWMA)
The EWMA dynamically adjusts to recent price movements:
mu_t = lambda * mu_{t-1} + (1 - lambda) * P_t
Where mu_t is the mean at time t, lambda is the decay factor, and P_t is the price at time t. The higher the decay factor, the more weight is given to recent data.
Autocorrelation (ρ) and Standard Deviation (σ)
To measure mean reversion speed and volatility: rho = correlation(log(close), log(close ), length) Where rho is the autocorrelation of log returns over a specified period.
To calculate volatility:
sigma = stdev(close, length)
Where sigma is the standard deviation of the asset's closing price over a specified length.
Upper and Lower Bands
The upper and lower bands are calculated as follows:
upper_band = mu + (threshold * sigma)
lower_band = mu - (threshold * sigma)
Where threshold is a multiplier for the standard deviation, usually set to 2. These bands represent the range within which the price is expected to fluctuate, based on current volatility and the mean.
🞘 Code extract // Calculate Returns
returns = math.log(close / close )
// Calculate Long-Term Mean (μ) using EWMA over the entire dataset
var float ewma_mu = na // Initialize ewma_mu as 'na'
ewma_mu := na(ewma_mu ) ? close : decay_factor * ewma_mu + (1 - decay_factor) * close
mu = ewma_mu
// Calculate Autocorrelation at Lag 1
rho1 = ta.correlation(returns, returns , corr_length)
// Ensure rho1 is within valid range to avoid errors
rho1 := na(rho1) or rho1 <= 0 ? 0.0001 : rho1
// Calculate Speed of Mean Reversion (θ)
theta = -math.log(rho1)
// Calculate Volatility (σ)
sigma = ta.stdev(close, corr_length)
// Calculate Upper and Lower Bands
upper_band = mu + threshold * sigma
lower_band = mu - threshold * sigma
🔸Visualization via Table and Plotshapes
The table shows key statistics such as the current value of the dynamic mean (μ), the number of times the price has crossed the upper or lower bands, and the consecutive number of bars that the price has remained in an overbought or oversold state.
Plotshapes (diamonds) are used to signal buy and sell opportunities. A green diamond below the price suggests a buy signal when the price crosses below the lower band, and a red diamond above the price indicates a sell signal when the price crosses above the upper band.
The table and plotshapes provide a comprehensive visualization, combining both statistical and actionable information to aid decision-making.
🞘 Code extract // Reset consecutive_bars when price crosses the mean
var consecutive_bars = 0
if (close < mu and close >= mu) or (close > mu and close <= mu)
consecutive_bars := 0
else if math.abs(deviation) > 0
consecutive_bars := math.min(consecutive_bars + 1, dev_length)
transparency = math.max(0, math.min(100, 100 - (consecutive_bars * 100 / dev_length)))
🔶 INSTRUCTIONS
The Mean Reversion Cloud (Ornstein-Uhlenbeck) indicator can be set up by adding it to your TradingView chart and configuring parameters such as the decay factor, autocorrelation length, and volatility threshold to suit current market conditions. Look for price crossovers and deviations from the calculated mean for potential entry signals. Use the upper and lower bands as dynamic support/resistance levels for setting take profit and stop-loss orders. Combining this indicator with additional trend-following or momentum-based indicators can improve signal accuracy. Adjust settings for better mean-reversion detection and risk management.
🔸Step-by-Step Guidelines
🞘 Setting Up the Indicator
Adding the Indicator to the Chart:
Go to your TradingView chart.
Click on the "Indicators" button at the top.
Search for "Mean Reversion Cloud (Ornstein-Uhlenbeck)" in the indicators list.
Click on the indicator to add it to your chart.
Configuring the Indicator:
Open the indicator settings by clicking on the gear icon next to its name on the chart.
Decay Factor: Adjust the decay factor (λ) to control the responsiveness of the mean calculation. A higher value prioritizes recent data.
Autocorrelation Length: Set the autocorrelation length (θ) for calculating the speed of mean reversion. Longer lengths consider more historical data.
Threshold: Define the number of standard deviations for the upper and lower bands to determine how far price must deviate to trigger a signal.
Chart Setup:
Select the appropriate timeframe (e.g., 1-hour, daily) based on your trading strategy.
Consider using other indicators such as RSI or MACD to confirm buy and sell signals.
🞘 Understanding What to Look For on the Chart
Indicator Behavior:
Observe how the price interacts with the dynamic mean and volatility bands. The price staying within the bands suggests mean-reverting behavior, while crossing the bands signals potential entry points.
The indicator calculates overbought/oversold conditions based on deviation from the mean, highlighted by color-coded cloud areas on the chart.
Crossovers and Deviation:
Look for crossovers between the price and the mean (μ) or the bands. A bullish crossover occurs when the price crosses below the lower band, signaling a potential buying opportunity.
A bearish crossover occurs when the price crosses above the upper band, suggesting a potential sell signal.
Deviations from the mean indicate market extremes. A large deviation indicates that the price is far from the mean, suggesting a potential reversal.
Slope and Direction:
Pay attention to the slope of the mean (μ). A rising slope suggests bullish market conditions, while a declining slope signals a bearish market.
The steepness of the slope can indicate the strength of the mean-reversion trend.
🞘 Possible Entry Signals
Bullish Entry:
Crossover Entry: Enter a long position when the price crosses below the lower band with a positive deviation from the mean.
Confirmation Entry: Use additional indicators like RSI (above 50) or increasing volume to confirm the bullish signal.
Bearish Entry:
Crossover Entry: Enter a short position when the price crosses above the upper band with a negative deviation from the mean.
Confirmation Entry: Look for RSI (below 50) or decreasing volume to confirm the bearish signal.
Deviation Confirmation:
Enter trades when the deviation from the mean is significant, indicating that the price has strayed far from its expected value and is likely to revert.
🞘 Possible Take Profit Strategies
Static Take Profit Levels:
Set predefined take profit levels based on historical volatility, using the upper and lower bands as guides.
Place take profit orders near recent support/resistance levels, ensuring you're capitalizing on the mean-reversion behavior.
Trailing Stop Loss:
Use a trailing stop based on a percentage of the price deviation from the mean to lock in profits as the trend progresses.
Adjust the trailing stop dynamically along the calculated bands to protect profits as the price returns to the mean.
Deviation-Based Exits:
Exit when the deviation from the mean starts to decrease, signaling that the price is returning to its equilibrium.
🞘 Possible Stop-Loss Levels
Initial Stop Loss:
Place an initial stop loss outside the lower band (for long positions) or above the upper band (for short positions) to protect against excessive deviations.
Use a volatility-based buffer to avoid getting stopped out during normal price fluctuations.
Dynamic Stop Loss:
Move the stop loss closer to the mean as the price converges back towards equilibrium, reducing risk.
Adjust the stop loss dynamically along the bands to account for sudden market movements.
🞘 Additional Tips
Combine with Other Indicators:
Enhance your strategy by combining the Mean Reversion Cloud with momentum indicators like MACD, RSI, or Bollinger Bands to confirm market conditions.
Backtesting and Practice:
Backtest the indicator on historical data to understand how it performs in various market environments.
Practice using the indicator on a demo account before implementing it in live trading.
Market Awareness:
Keep an eye on market news and events that might cause extreme price movements. The indicator reacts to price data and might not account for news-driven events that can cause large deviations.
🔸Customize settings 🞘 Decay Factor (λ): Defines the weight assigned to recent price data in the calculation of the mean. A value closer to 1 places more emphasis on recent prices, while lower values create a smoother, more lagging mean.
🞘 Autocorrelation Length (θ): Sets the period for calculating the speed of mean reversion and volatility. Longer lengths capture more historical data, providing smoother calculations, while shorter lengths make the indicator more responsive.
🞘 Threshold (σ): Specifies the number of standard deviations used to create the upper and lower bands. Higher thresholds widen the bands, producing fewer signals, while lower thresholds tighten the bands for more frequent signals.
🞘 Max Gradient Length (γ): Determines the maximum number of consecutive bars for calculating the deviation gradient. This setting impacts the transparency of the plotted bands based on the length of deviation from the mean.
🔶 CONCLUSION
The Mean Reversion Cloud (Ornstein-Uhlenbeck) indicator offers a sophisticated approach to identifying mean-reversion opportunities by applying the Ornstein-Uhlenbeck stochastic process. This dynamic indicator calculates a responsive mean using an Exponentially Weighted Moving Average (EWMA) and plots volatility-based bands to highlight overbought and oversold conditions. By incorporating advanced statistical measures like autocorrelation and standard deviation, traders can better assess market extremes and potential reversals. The indicator’s ability to adapt to price behavior makes it a versatile tool for traders focused on both short-term price deviations and longer-term mean-reversion strategies. With its unique blend of statistical rigor and visual clarity, the Mean Reversion Cloud provides an invaluable tool for understanding and capitalizing on market inefficiencies.

Multi-Step FlexiSuperTrend - Indicator [presentTrading]This version of the indicator is built upon the foundation of a strategy version published earlier. However, this indicator version focuses on providing visual insights and alerts for traders, rather than executing trades. This one is mostly for @thorcmt.
█ Introduction and How it is Different
The **Multi-Step FlexiSuperTrend Indicator** is a versatile tool designed to provide traders with a highly customizable and flexible approach to trend analysis. Unlike traditional supertrend indicators, which focus on a single factor or threshold, the **FlexiSuperTrend** allows users to define multiple levels of take-profit targets and incorporate different trend normalization methods.
It comes with several advanced customization features, including multi-step take profits, deviation plotting, and trend normalization, making it suitable for both novice and expert traders.
BTCUSD 6hr Performance
█ Strategy, How It Works: Detailed Explanation
The **Multi-Step FlexiSuperTrend** works by calculating a supertrend based on multiple factors and incorporating oscillations from trend deviations. Here’s a breakdown of how it functions:
🔶 SuperTrend Calculation
At the heart of the indicator is the SuperTrend formula, which dynamically adjusts based on price movements.
🔶 Normalization of Deviations
To enhance accuracy, the **FlexiSuperTrend** calculates multiple deviations from the trend and normalizes them.
🔶 Multi-Step Take Profit Levels
The indicator allows setting up to three take profit levels, which are displayed via price level alerts. lows traders to exit part of their position at various profit intervals.
For more detail, please check the strategy version - Multi-Step-FlexiSuperTrend-Strategy:
and 'FlexiSuperTrend-Strategy'
█ Trade Direction
The **Multi-Step FlexiSuperTrend Indicator** supports both long and short trade directions.
This flexibility allows traders to adapt to trending, volatile, or sideways markets.
█ Usage
To use the **FlexiSuperTrend Indicator**, traders can set up their preferences for the following key features:
- **Trading Direction**: Choose whether to focus on long, short, or both signals.
- **Indicator Source**: The price source to calculate the trend (e.g., close, hl2).
- **Indicator Length**: The number of periods to calculate the ATR and trend (the larger the value, the smoother the trend).
- **Starting and Increment Factor**: These adjust how reactive the trend is to price movements. The starting factor dictates how far the initial trend band is from the price, and the increment factor adjusts subsequent trend deviations.
The indicator then displays buy and sell signals on the chart, along with alerts for each take-profit level.
Local picture
█ Default Settings
The default settings of the **Multi-Step FlexiSuperTrend** are carefully designed to provide an optimal balance between sensitivity and accuracy. Let’s examine these default parameters and their effect on performance:
🔶 Indicator Length (Default: 10)
The **Indicator Length** determines the lookback period for the ATR calculation. A smaller value makes the indicator more reactive to price changes, but may generate more false signals. A longer length smooths the trend and reduces noise but may delay signals.
Effect on performance: Shorter lengths perform better in volatile markets, while longer lengths excel in trending markets.
🔶 Starting Factor (Default: 0.618)
This factor adjusts the starting distance of the SuperTrend from the current price. The smaller the starting factor, the closer the trend is to the price, making it more sensitive. Conversely, a larger factor allows more distance, reducing sensitivity but filtering out false signals.
Effect on performance: A smaller factor provides quicker signals but can lead to frequent false positives. A larger factor generates fewer but more reliable signals.
🔶 Increment Factor (Default: 0.382)
The **Increment Factor** controls how the trend bands adjust as the price moves. It increases the distance of the bands from the price with each iteration.
Effect on performance: A higher increment factor can result in wider stop-loss or trend reversal bands, allowing for longer trends to develop without frequent exits. A lower factor keeps the bands closer to the price and is more suited for shorter-term trades.
🔶 Take Profit Levels (Default: 2%, 8%, 18%)
The default take-profit levels are set at 2%, 8%, and 18%. These values represent the thresholds at which the trader can partially exit their positions. These multi-step levels are highly customizable depending on the trader’s risk tolerance and strategy.
Effect on performance: Lower take-profit levels (e.g., 2%) capture small, quick profits in volatile markets, while higher levels (8%-18%) allow for a more gradual exit in strong trends.
🔶 Normalization Method (Default: None)
The default normalization method is **None**, meaning the deviations are not normalized. However, enabling normalization (e.g., **Max-Min**) can improve the clarity of the indicator’s signals in volatile or choppy markets by smoothing out the noise.
Effect on performance: Using a normalization method can reduce the effect of extreme deviations, making signals more stable and less prone to false positives.

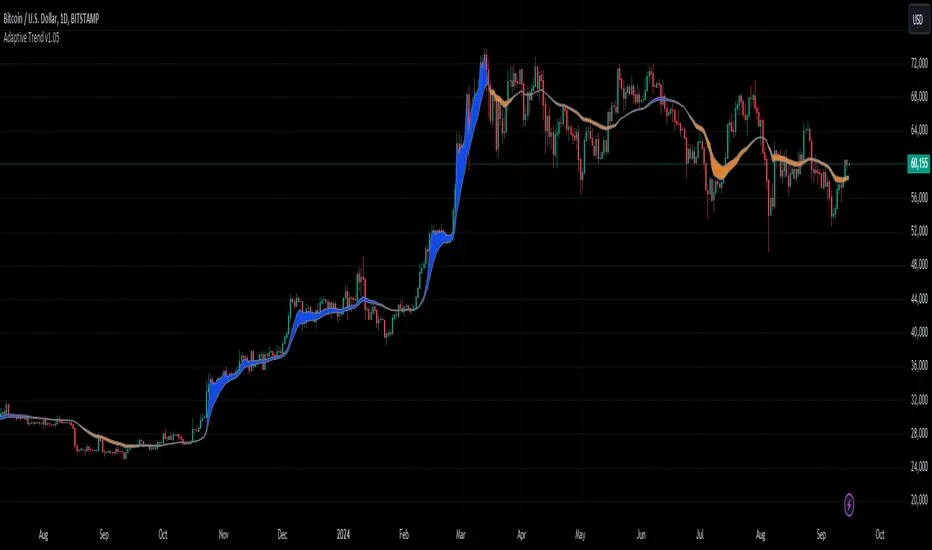
Adaptive Trend [StabTrading]The Adaptive Trend is a versatile tool designed to help traders stay in trades longer by adapting to real-time market conditions. Based on the Exponential Moving Average (EMA) trend, this indicator automatically adjusts its values according to the flow of money, making it a fully automated and responsive trend-following tool. Traders can use this adaptive trend to maintain positions longer and identify optimal entry and exit points before the trend fully reverses.
💡 Features
EMA-Based Trend - The Adaptive Trend Indicator is grounded in the EMA, providing a reliable foundation for tracking market trends.
Adaptive Values - The indicator’s values change dynamically based on money flow, allowing it to adjust to market conditions automatically.
Designed for Longer Trades - This tool is specifically designed to keep traders in trades for extended periods, maximizing potential profits.
Automated Algorithm - The fully automated nature of this indicator ensures that it adapts without manual intervention, making it user-friendly and efficient.
Pre-Trend Flip Signals - Traders can utilize this indicator to spot entry and exit points before a trend reversal, offering a strategic advantage in trade timing.
📈 How to Use the Adaptive Trend Indicator
The Adaptive Trend Indicator is designed to help traders identify potential entry and exit points by observing the relationship between price and the trend line. Generally, the price should follow the trend line's momentum. However, when the price deviates from the trend line, this indicates a divergence in momentum, signalling a potential trading opportunity.
Monitor the Trend Line - Pay attention to the color and flatness of the trend line. A blue trend line indicates bullish momentum, while a yellow trend line signals bearish momentum. When the trend line starts to flatten, it suggests that the current momentum is weakening. This is the time to watch for price deviations from the trend line as potential trade signals.
🛠️ Usage/Practice
As the downward trend begins to lose momentum, the trend line flattens and shows early signs of money flow moving up. This flattening indicates a potential shift in market sentiment, suggesting that a reversal may be on the horizon.
The trend line changes to blue, indicating a bullish shift in momentum. Since the price is close to the trend line, this serves as a strong confirmation to enter a long trade. The proximity to the trend line offers a favourable risk-to-reward ratio.
The trend line begins to level out, signalling a potential slowdown in momentum. Notice how the price starts to deviate from the trend line. As price rises above the trend line, this presents an opportunity to take partial profits or initiate a covered sell position.
The price briefly dips below the blue trend line, and the trend itself remains flat, indicating the bullish trend’s resilience. As the trend line stays blue, this suggests that the upward momentum remains intact, and the dip may be temporary, offering another potential entry point.
Despite the trend line flattening, the price continues to respect the trend, suggesting that the uptrend has not exhausted itself. This continuation implies that the bullish trend is still likely to persist.
The trend line flips, signalling a clear end to the previous upward trend. This flip is a strong indication that the bullish momentum has been fully exhausted, and a reversal may be in progress. Notice how the price has respected the trend line as it flips.
The trend line has shifted to yellow, signalling downward price action. As the trend begins to flatten and shows signs of moving upward again, traders should wait for the price to cross above the trend line. This crossing could indicate a safer entry point for a sell trade, as the market may still be in a bearish phase.
The price drops sharply below the trend line, but the trend itself remains relatively stable, suggesting that the downward momentum may not be as strong as the price action suggests. This discrepancy signals an opportune moment to take profits and potentially enter a buy position.
The price is not aligning with the trend line, suggesting the market may be trending sideways. The trend currently shows bullish momentum, but it lacks strong upward acceleration, and the price is significantly above the trend line. This weakening momentum indicates a potential area to consider a sell trade. Similar to point 8, the lack of acceleration and the distance from the trend line suggest that the upward movement may be losing strength.
While the trend remains in a downward (yellow) phase, it begins to rise without flipping to blue. This suggests that upward momentum is weak. As the price significantly deviates above the trend line, traders might consider entering a new sell trade, as the upward movement within a downward trend could indicate a temporary correction rather than a full reversal.
🔶 Conclusion
The Adaptive Trend allows traders to maintain their positions longer while providing strategic entry and exit points before trends fully reverse. As part of a comprehensive trading system, this indicator is particularly valuable for those looking to capitalize on subtle shifts in market momentum. By following its guidelines and signals, traders can better align their strategies with market dynamics.
Kenji Indicator Version 2.0KenJi Indicator Version 2.0
Indicator Class : Average analysis/trend following
Trading type : Any
Time frame : Any
Purpose : Trend-based trading
Level of aggressiveness : Flexible
Introduction
The basic rule of trading is as follows: "trend is your friend." Means, it is extremely important to follow the current market sentiments rather than resisting them. Following this principle allows a trader to feel as comfortable as possible during the trading: positions typically are in a profit zone and there is no psychological pressure of a negative financial result that often leads to hasty position closures.
Despite the advantages of trend-following strategies, many traders struggle to accurately identify the prevailing trend and market sentiments, resulting in bad trading decisions and, consequently, unfavorable trading outcomes.
To address these challenges, streamline the analysis process, and enhance the overall quality of trading decisions, our team of analysts has developed The KenJi Indicator Version 2.0.
About the KenJi Indicator Version 2.0
The KenJi Indicator Version 2.0 offers a novel approach to traditional average-based analysis. Many conventional strategies relying on averages tend to generate numerous false signals, especially in “flat” markets where frequent crossovers and shifts in direction are common. This reduces the overall effectiveness of average analysis.
The KenJi Indicator Version 2.0 addresses these issues by incorporating a unique algorithm, which combines correlation and moving average analysis to avoid the pitfalls of traditional methods. It accurately identifies market conditions—indicated by colors: red for a downtrend, blue for an uptrend, and green for a “flat” market—thereby improving the quality of signals and helping traders manage trends more effectively.
The KenJi Indicator Version 2.0 indicator not only identifies optimal entry points but also assists in timing exits for profit-taking. Moreover, it assesses the aggressiveness of signals, making it suitable for both novice and experienced traders.
Trading Rules
Using the KenJi Indicator Version 2.0 is straightforward. When the price enters the buy or sell zone—represented by a blue or red area between the fast and slow averages—it generates a signal to enter a position. This position remains active until the market condition changes (such as a shift from a downtrend to “flat”) or until a close signal appears, indicated by a significant divergence shown by a blue or red cross.
Indicator Structure
The KenJi Indicator Version 2.0 consists of colored zones, level lines and stop crosses:
Trend Zones : These are color-coded (blue, red, or green) to highlight trend conditions and entry points.
Level Lines : The lines indicate the nearest support/resistance lines (red for resistance, blue for support). Available for 4H time-frame and below
Stop Crosses : Blue or Red crosses are displayed on the Chart to show the moments of extreme price divergence from the current trend. A good moment to fix profits.
For ease of use, the indicator shows buy and sell signals directly on the chart.
Signal Types:
Standard : Uses the basic lot size for trades.
Aggressive : Uses double the standard lot size for higher risk/reward trades.
Profit zones are marked by blue/red x-crosses: red x-crosses indicate "sell" take-profit zones, while blue x-crosses indicate "buy" take-profit zones.
Alerts and Notifications
The indicator includes built-in alerts and notifications, ensuring traders don’t miss any "buy" or "sell" signals.
Input Parameters
The KenJi Indicator Version 2.0 offers several input parameters for customization:
Slow Average Period : Defines the period for the slow average. Longer periods provide a more stable, conservative response to price changes.
Fast Average Period : Defines the period for the fast average. Similar to the slow average, a longer period provides more conservative signals.
Correlation Period : Used to calculate the Pearson correlation coefficient and estimate the relationship between the fast and slow averages, improving trend identification.
Divergence Sensitivity : Determines the placement of take-profit zones, with higher values increasing the distance of these zones.
Access to the KenJi Indicator Version 2.0
For more information or to request access to the Kenji 2.0 Indicator, please send inquiries via private messages.

Smart Signals Assistant [AlgoAlpha]🟠 OVERVIEW
The Smart Signals Assistant is a comprehensive, all-in-one trading toolkit designed to provide a complete analytical framework on your chart. It is built around a primary signal engine that generates trend and reversal signals, enhanced by a suite of five optional "confluence" indicators that provide deeper market context.
This script is highly modular, allowing you to build a personalized dashboard. You can use the main signals for entries, add a machine-learning classifier to check if the market is trending, overlay dynamic support/resistance clouds, and manage your trades with on-chart take-profit and stop-loss levels. The system is tied together with a powerful, multi-step alert builder that lets you create custom alert conditions from any combination of the script's components.
🟠 CONCEPTS
This indicator is a collection of several distinct systems working together. The combination is designed to allow traders to build a complete strategy—from signal generation to confirmation and trade management—within a single tool. Here are the core concepts behind them:
Smart Signals Engine: This is the heart of the indicator and operates as a hybrid with two distinct modes. The "Swing" mode uses a proprietary model that analyzes price stability and volatility to identify stable, longer-term trends. The "Scalping" mode uses a more responsive machine-laerning trend system that dynamically adapts its parameters based on learned market 'states' to real-time changes in market conditions, making it better suited for faster, lower-timeframe movements.
Fair Value Trail (FVT): This is not a simple moving average. It's a volatility-based trail that helps identify dynamic zones of support and resistance. The concept is to track a "fair value" price, derived by analyzing price levels with significant volume activity, providing logical areas for entries or trailing stop-loss adjustments.
Trend Spine: This component calculates a core trend backbone. Its purpose is to cut through short-term noise and provide a clearer, more stable view of the underlying primary trend direction by filtering out price action during periods of low directional momentum.
Trend Bias: This is a band that measures the strength and weakness of the current price momentum. It visualizes whether bullish or bearish pressure is accelerating or decelerating by comparing recent momentum to its historical average, which is useful for confirming the conviction behind a move.
Firmament Clouds: These are dynamic zones plotted on the chart that act as potential areas of support and resistance. Unlike static lines, these clouds expand and contract based on market volatility, providing an adaptive view of key price zones where the market may be overextended.
Trend-Range Classifier (TRC): This is a machine learning model that analyzes multiple market characteristics (like volatility and momentum patterns) in real-time. It classifies the current market environment as either "trending" or "ranging," helping you decide which strategy to apply and filter signals that are inappropriate for the current conditions.
🟠 FEATURES
Trend & Reversal Signals: Configure the main engine to provide either trend-following signals or potential counter-trend reversal signals. Signals are categorized as "Normal" or "Strong" to indicate conviction.
Advanced Candle Coloring: Choose from multiple candle coloring modes, including static trend colors, a color gradient based on momentum, or a gradient based on volume. Also includes an option to highlight ranging markets with gray candles.
Automated Trade Management: Enable on-chart Take-Profit and Stop-Loss levels that are automatically calculated when a signal appears. These are visualized with colored risk/reward zones.
Component Status Table: A customizable on-chart dashboard that shows the live status, direction, and signal duration for every active component, giving you a complete overview at a glance.
Powerful Multi-Step Alert System: Build highly specific, custom alerts. You can combine dozens of built-in conditions from all components using AND/OR logic across a sequence of up to 7 steps.
External Alert Integration: The alert system can incorporate up to five external sources, allowing you to mix conditions from this script with your other favorite indicators.
🟠 USAGE
This script is designed to be adapted to your personal trading style by combining components to build a complete strategy. The synergy between the components is key to its usefulness. Here is a general workflow:
Initial Configuration: Start by enabling the core "Smart Signals" in the settings. Choose your preferred "Smart Signals Mode" (Swing or Scalping) and "Signal Mode" (Trend or Reversal) based on your strategy and timeframe.
Adding Confluence for Reliability: To increase the reliability of signals, enable one or more confluence tools. For example, a trend trader can enable the "Trend-Range Classifier" and decide to only consider signals that appear when the market is classified as "Trending." You could further enhance this by also enabling the "Fair Value Trail" and only taking buy signals that occur near or above the trail. This demonstrates how combining components filters for higher-quality setups.
Reading the Visuals: A standard "▲" or "▼" represents a normal signal, while a "+▲" or "+▼" indicates a strong signal with higher conviction. Use the candle colors to gauge the momentum within the trend.
Managing Trades: If you enable "Take-Profit Levels" and "Stop-Loss Level," the script will automatically plot these on your chart when a signal appears. This can help you pre-plan your risk and potential targets. The exit signals ("x") can be used as a suggestion for taking partial or full profits.
Setting Up Custom Alerts for High-Probability Setups: For a high-probability setup, navigate to the "Alerts" tab. You can create a sequence that combines multiple components to fire only on your ideal conditions. For instance:
Step 1: "Smart Signals Strong Bullish Signal "
Step 2: "Market Is Trending " AND "FVT In Bullish Trend "
This alert would only trigger when a strong buy signal occurs while the TRC confirms a trend and the price is in a favorable position relative to the Fair Value Trail, effectively filtering out lower-quality signals by demanding agreement between multiple, conceptually different components.
Bezahltes Script

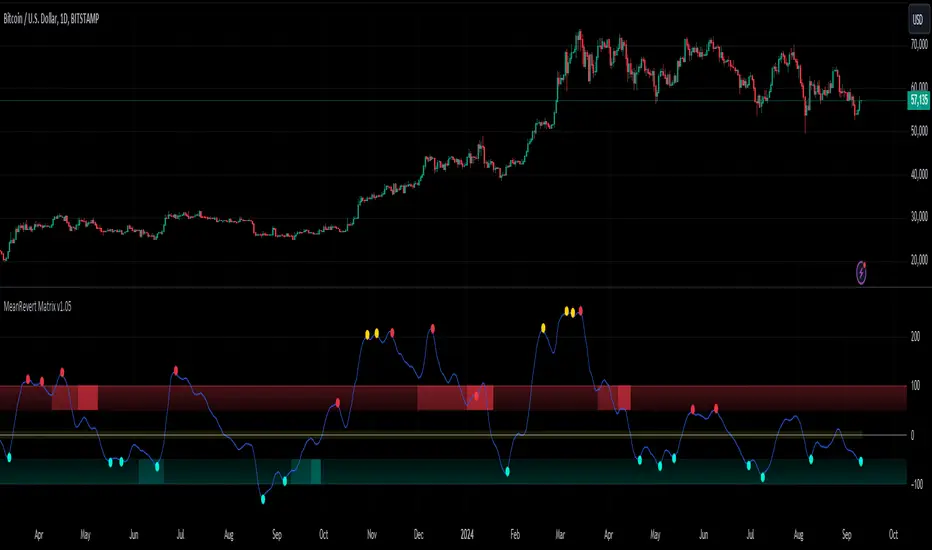
MeanRevert Matrix [StabTrading]MeanRevert Matrix is a sophisticated trading tool designed to detect when prices significantly deviate from their historical averages, signalling potential market trends and reversals.
Leveraging complex algorithms that incorporate human emotions and mean reversion theory, this indicator is the first stage in a comprehensive system for identifying market entry points. Its versatility allows it to be applied across all charts and timeframes, providing traders with clear visual cues for trend analysis and decision-making.
This indicator is purposefully straightforward, allowing traders to observe how the different algorithms work in confluence. The MeanRevert Matrix can be customized to fit individual trading styles, particularly in terms of aggressiveness, making it adaptable to various market conditions. Working in tandem with the FloWave Oscillator, it offers an additional layer of confluence, ensuring that trading signals are more reliable.
💡 Features
Reversal Zones - These zones are integral to the MeanRevert Matrix, highlighting areas where trader emotions and money flow suggest potential longer-term reversals. The lighter shaded zones indicate early-stage reversals, while darker shades signal stronger reversal potential. This feature is designed to help traders anticipate market shifts and prepare for them accordingly.
Localized Mean Reversion Signals - These signals are triggered when the price deviates significantly from the mean, unaffected by longer-term price movements. This localized algorithm helps traders focus on short-term market fluctuations without being influenced by broader trends.
Yellow Signals - These signals identify isolated overbought or oversold conditions. While they often indicate reversal points, they can also signal the beginning of accelerated buying or selling, giving traders early warning of potential market shifts.
Trading Style Customization - The MeanRevert Matrix allows traders to tailor their strategy by adjusting the indicator’s aggressiveness. A more aggressive setting will produce more frequent reversal signals, offering flexibility based on the trader’s risk tolerance and market outlook.
Noise Eliminator - This feature helps traders filter out market noise or manipulation by increasing the noise value. By removing unwanted or misleading signals, it ensures that traders are acting on the most reliable data.
📈 Implementing the System
Step 1 - Begin by observing the localized blue trend to identify reversal points below the mean. Green or red signals within this trend indicate that the price remains within the current market parameters, suggesting that a reversal may occur more quickly. Yellow signals, however, indicate that the trend is likely to continue, so it’s advisable to wait for clearer reversal zones to develop. To avoid misleading signals, consider using higher noise values.
Step 2 - Wait for the reversal zone algorithm to indicate a potential market reversal by showing either light or dark red/green colour. A lighter zone suggests that the overall trend is beginning to reverse, while a darker zone indicates a higher likelihood of reversal.
Step 3 - Once a reversal zone is identified, monitor the trend line for signals that the price is moving significantly away from the mean. This indicates a strong localized price movement that is poised for a reversal. At this stage, you can reduce the noise value and increase the aggressiveness of the trading style to capture more reversal signals.
🛠️ Usage/Practice
In the example above, the indicator is set with neutral aggression for buy signals and lower aggression for sell signals, reflecting the current bull market cycle
Red Reversal Zone - A bearish reversal zone emerges, followed by a darker bearish zone, indicating an increased probability of a trend reversal. The red signals show price reversion from the localized mean, but the absence of yellow signals suggests the reversion isn't abnormally aggressive, making this a good area to consider a short position.
Strong Reversal Opportunity - Similar to point 1, but this time a green signal appears within the bullish dark green zone, highlighting a strong reversal potential. Subsequent red signals suggest opportunities to take profits as the trend faces resistance.
Opportunity to Strengthen Long Position - Once again, the indicator shows a bullish reversal zone without yellow signals. This suggests an area of increased resistance at this price point, offering traders another chance to increase their long positions before the market enters the long bull cycle.
Excessive Buying Pressure - The price has deviated significantly from the mean, triggering a yellow signal. This indicates excessive buying pressure, suggesting the trend is likely to continue upward. Although not an immediate bearish area, the red sell signals suggest it could be a time to conservatively take partial profits.
Trend Weakening - As the trend slows down, bearish zones appear, indicating potential reversal points. As the market shows signs of losing upward momentum, this suggests an opportunity to reduce their long exposure or enter a short trade and take advantage of the correction in the bull cycle.
Potential for Additional Long Position - Despite the earlier sell signals, the overall uptrend remains strong. This presents an opportunity either to add to the long position or to take profits from a previous sell position. The strength of the upward trend suggests that the market may continue higher.
Abnormal Upward Momentum - Similar to points 4 and 5, the yellow signals indicate abnormal price action with aggressive upward momentum. As the trend corrects to a normal range, the price hitting a resistance level is confirmed by the appearance of red reversal zones, suggesting a potential pullback.
Sideways Market Signals - In a sideways market, the indicator shows signals that remain within the normal mean reversion range. These signals are not abnormal and suggest potential entry points for trades within a sideways market, indicating periods where the market lacks strong directional momentum.
🔶 Conclusion
With its seamless integration into various charts and timeframes, the MeanRevert Matrix stands as a reliable and adaptable tool, essential for navigating the complexities of modern markets. By following the implementation guidelines and leveraging its features, traders have the potential to effectively anticipate market movements and optimize their entry and exit points.
We developed this indicator to help traders enhance their understanding of market trends and achieve their trading objectives with greater precision.
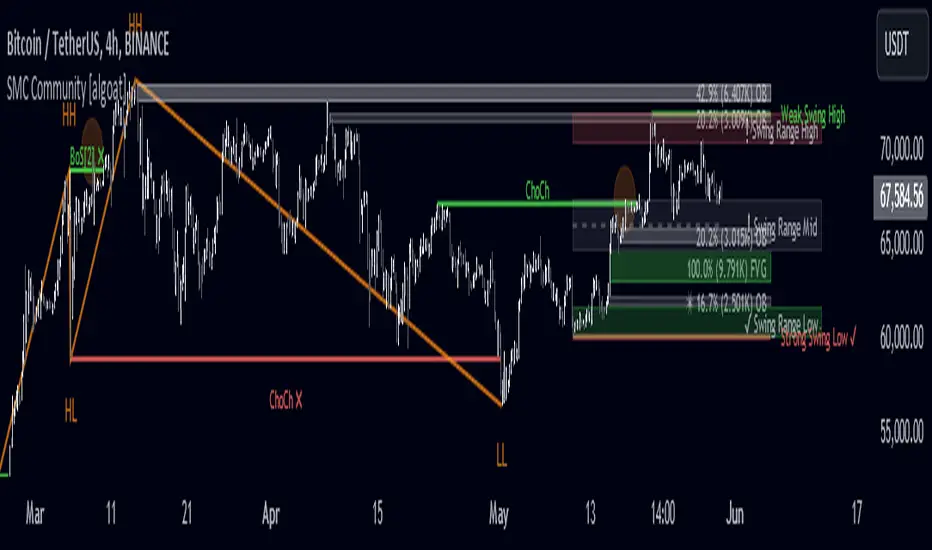
MTF Breaker Blocks [SMRT Algo]The SMRT Algo Breaker Blocks (BBs) indicator offers an advanced methodology for traders by highlighting breaker blocks, a critical concept in technical analysis that indicates potential areas of support and resistance. This indicator not only identifies these key zones but also integrates breakout signals and premium/discount swing levels to guide traders in setting take profit and stop loss targets. The system includes customizable alerts for each signal, ensuring that traders are promptly notified of important market events.
Breaker blocks are identified after a mitigated order block, which signifies a change in polarity—where a previous resistance turns into support or vice versa (or previous demand turned supply).
The indicator uses price action analysis to determine these zones, which are crucial for identifying potential reversal points or continuation patterns. By focusing on these areas, traders can anticipate where significant price reactions are likely to occur.
Features:
Bullish Breaker Blocks: A bullish BB is generated when a previous supply zone is broken. This setup indicates that the market may be transitioning from a downtrend to an uptrend.
Bearish Breaker Blocks: A bearish BB is created when a previous demand zone is broken, thus creating a new bearish BB. This scenario suggests a potential shift from an uptrend to a downtrend.
Sensitivity: Traders can adjust the indicator’s sensitivity, influencing how it detects swings and constructs breaker blocks. Higher sensitivity results in shorter-term breaker blocks, while lower sensitivity focuses on longer-term BBs.
Alerts: Alerts can be configured for each signal type, ensuring that traders are notified of potential opportunities in real time.
Traders can utilize Breaker Block (BB) zones in multiple strategic ways to enhance their trading decisions:
Profit Targets: BB zones can serve as predefined areas where traders look to take profits. Since these zones represent significant levels of potential support or resistance, they are logical points where the price might reverse or consolidate. By targeting these zones, traders can set realistic and strategic exit points that align with the market's natural behavior, thereby optimizing their profit-taking strategy.
Risk Management: Using BB zones for profit targets also assists in managing risk, as it allows traders to plan their trades with a clear understanding of where they expect the market to move. This foresight helps in setting stop-loss levels relative to the BB zones, creating a balanced risk-reward profile for each trade.
Entry Points & Anticipating Reversals: BB zones are ideal entry points for trades because they highlight areas where a change in price direction is likely. Traders can enter long positions near a BB zone acting as support or short positions near a BB zone acting as resistance. This approach leverages the natural tendency of prices to respect these significant levels, increasing the probability of entering a trade just as the market begins to move in the desired direction.
Confirmation with Additional Indicators: While BB zones can be strong standalone signals, their effectiveness can be further enhanced when used in conjunction with other technical indicators, such as moving averages, RSI, or MACD. This combined approach can provide additional confirmation and improve the reliability of the entry signals, making it a versatile tool in a trader's arsenal.
Inputs:
Timeframe: Changes the Breaker Block timeframe
Sensitivity: Adjust the sensitivity of the BB zones. A smaller value will lead to fewer zones generated on the chart, and a higher value will lead to more zones shown.
Width: Adjust the width (size) of the zones. A smaller value will result in smaller zones, while a larger value will result in larger zones.
Color: Freely adjust the color of bullish and bearish breaker blocks.
Breaker Block Length: Adjust the offset (to the right) of the breaker block zones.
Timeframe Label: The timeframe label is displayed on the top right corner, and can be turned on/off. It shows the timeframe of the MTF Breaker Block. The position and size of the label can also be adjusted.
By incorporating BB zones into their trading strategy, traders can develop a more structured and disciplined approach to both entering and exiting trades, leveraging the unique characteristics of these zones to optimize their trading outcomes.
These components collectively create a system for identifying and trading market reversals and continuations. The breaker blocks provide a structural basis, highlighting areas of potential price reaction.
SMRT Algo’s proprietary approach to identifying and confirming breaker blocks, coupled with our comprehensive alert system, offers a significant edge over standard indicators. This indicator not only provides signals but also embeds a complete trading framework, guiding users through both entry and exit processes with built-in risk management.
Multi-Timeframe Breaker Blocks by SMRT delivers precise and actionable insights making it a valuable asset for serious traders. Traders receive a tool that is both powerful and user-friendly, capable of enhancing their trading performance and decision-making process.
The SMRT Algo Suite offers a comprehensive set of tools and features that extend beyond the capabilities of standard or open-source indicators, providing significant additional value to users.
SMRT Algo Suite includes:
Advanced Customization: Users can customize various aspects of the indicator, such as toggling the confirmation signals on or off and adjusting the parameters of the MA Filter. This customization enhances the adaptability of the tool to different trading styles and market conditions.
Enhanced Market Understanding: The combination of pullback logic, dynamic S/R zones, and MA filtering offers traders a nuanced understanding of market dynamics, helping them make more informed trading decisions.
Unique Features: The specific combination of pullback logic, dynamic S/R, and multi-level TP/SL management is unique to SMRT Algo, offering features that are not readily available in standard or open-source indicators.
Educational and Support Resources: As with other tools in the SMRT Algo suite, this indicator comes with comprehensive educational resources and access to a supportive trading community, as well as 24/7 Discord support.
The educational resources and community support included with SMRT Algo ensure that users can maximize the indicators’ potential, offering guidance on best practices and advanced usage.
SMRT Algo believe that there is no magic indicator that is able to print money. Indicator toolkits provide value via their convinience, adaptibility and uniqueness. Combining these items can help a trader make more educated; less messy, more planned trades and in turn hopefully help them succeed.
RISK DISCLAIMER
Trading involves significant risk, and most day traders lose money. All content, tools, scripts, articles, and educational materials provided by SMRT Algo are intended solely for informational and educational purposes. Past performance is not indicative of future results. Always conduct your own research and consult with a licensed financial advisor before making any trading decisions.

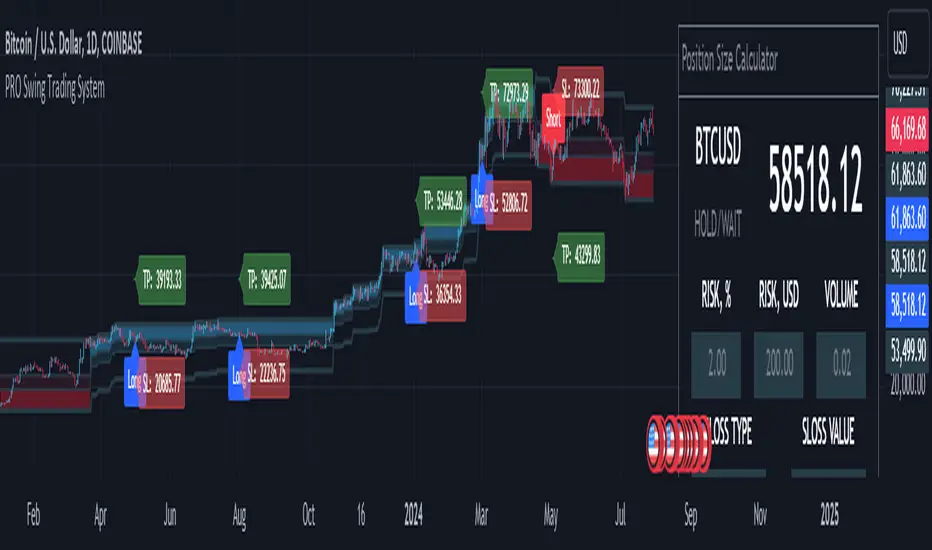
MQLSoftware - Pro Swing Trading SystemThe PRO Swing Trading System for TradingView is an advanced, fully integrated trading solution designed for traders who demand precision, versatility, and convenience in their trading strategies. Part of our Premium Collection, this system combines robust algorithms with hyper-customizable features to help traders effectively capitalize on market swings across various asset classes.
Our system embodies a comprehensive approach to trading, emphasizing risk management and capital preservation while maximizing trading efficiency. By seamlessly integrating risk management tools directly within the trading terminal, the PRO Swing Trading System eliminates the need for external spreadsheets or complex calculations, ensuring that traders can focus solely on executing their strategies. Every aspect of this system is designed to provide a streamlined, user-friendly experience where entry points, stop-loss levels, and take-profit targets are automatically calculated and displayed, allowing for rapid decision-making and execution.
KEY FEATURES
Advanced Trend Channels and Swing Levels
The PRO Swing Trading System features a unique, color-coded trend channel that visually adapts based on market trends. This channel helps traders identify optimal entry points by highlighting key swing levels for potential reversals or trend continuations. The system marks these levels on the chart as potential entry points for long or short positions, providing a clear visual cue for trading opportunities.
Comprehensive Signal and Trade Levels
Clear Stop-Loss and Take-Profit Levels: The system automatically marks stop-loss and take-profit levels on your charts, including absolute values to support informed decision-making. Traders can adjust these levels directly on the chart to match their trading style and risk tolerance, ensuring that risk management is always at the forefront of their trading strategy.
Dynamic Signal Adjustments: Customize your signals based on trend strength and market volatility to ensure you receive alerts that align with your specific trading strategies. This flexibility allows for a tailored trading experience that can adapt to various market conditions.
This image showcases a chart of BTC/USD on a one-hour timeframe. Here, we highlight the system's functionality, illustrating how different colors represent ascending and descending trends. The image includes features such as the Descending Channel, Extending Channel, Main Swing Level, Echo Swing Level, and Potential Entry points.
Additionally, it displays levels for managing profits and losses, such as Take Profit Levels and Stop Loss Level. The system allows setting either one or two take-profit levels for staged exit strategies. Traders can enter positions based on the Main Swing Level (primary entry point) or Echo Swing Level (secondary entry point), depending on their trading style or market conditions. This flexibility is useful for phased entry or if the primary entry opportunity is missed.
Integrated Position Size Calculator
Located in the top-right corner of the chart by default, the Position Size Calculator is a powerful tool that helps traders quickly determine the optimal trade size based on their risk settings. By integrating this calculator directly into the chart, traders can efficiently manage their trades with precision and confidence.
Configurable Risk Management: The calculator allows traders to set risk percentages, stop-loss types, and profit-to-loss ratios. It dynamically adjusts based on user inputs, optimizing trade volume and risk management to support a systematic trading approach.
This image presents a chart of ETH/USD on a 15-minute timeframe, clearly demonstrating the system’s ability to track trend changes accurately. The chart emphasizes the Position Size Calculator, part of the Risk Money Management Block. This panel allows users to set their risk (e.g., 2% of the deposit) and automatically calculates the appropriate position size. Absolute stop-loss and take-profit values are also calculated based on these settings, maintaining a consistent risk-reward ratio and supporting systematic trading.
Trend Strength Monitor
The Trend Strength Monitor is an essential tool for multi-timeframe analysis, helping traders identify the direction and strength of trends across higher timeframes. This feature aids in filtering out lower-probability trades, enhancing decision-making accuracy and ensuring that traders align their trades with the broader market trend.
This image features a chart of XAU/USD on an hourly timeframe, highlighting the Trend Strength Monitor. This tool helps traders understand the trend direction and strength across higher timeframes. The example shows that all higher timeframes indicate a buying zone, suggesting a safer long trade.
FILTERS AND SYSTEM USAGE
The indicator is equipped with a wide range of additional settings and filters that allow traders to adapt it to their specific needs and market conditions. Key features include:
Customizable Channel Width
The channel width is a crucial parameter that determines the indicator's adaptability to different market conditions. Traders can adjust the channel width to ensure the indicator responds quickly to market changes while remaining stable against false fluctuations. This flexibility is vital for trading in varying market conditions, such as ranging or trending markets.
Signal Frequency Control
This setting allows traders to control the frequency of signals generated by the system. By adjusting this parameter, traders can customize their trading approach to match their preferred style, whether it be a conservative, medium, or aggressive approach.
Alert and Notification Settings
The PRO Swing Trading System includes customizable alert settings to ensure traders are notified when key market conditions align with their strategy. Alerts can be set for specific entry points, trend reversals, or other significant market events, helping traders stay on top of their trades.
Trading Time Filters
Traders can set time filters to restrict trading activity to specific times of the day or week, ensuring their trading aligns with their schedule and market preferences. This feature is particularly useful for those who trade part-time or prefer to avoid trading during certain market sessions.
This image depicts a potentially risky LONG trade scenario after a prolonged downward movement on the AMD on an hourly timeframe. The recommendation is to avoid this trade, as the next three higher timeframes (H4, D1, W1) are in the red zone, indicating strong bearish trends.
CONCLUSION & ACCESS
The PRO Swing Trading System for TradingView is a powerful tool for traders who value precision, adaptability, and streamlined trading operations. With its advanced features, such as customizable trend channels, dynamic signal adjustments, and integrated risk management tools, this system supports a disciplined and systematic approach to trading. It's designed to enhance your trading experience by providing all the necessary tools to make informed decisions without the need for external resources.
To gain immediate access and start using the PRO Swing Trading System today, please refer to the Author's instructions below.
Arithmetic Candlesticks (Zeiierman)█ Arithmetic Candlestick - Overview
Arithmetic Candlesticks (Zeiierman) introduce a new way to read charts by applying logical arithmetic to real price data. These candlesticks focus on filtering out noise and smoothing price movements using a bell-shaped curve, which helps to refine the data and highlight the true trend. This approach provides a clearer view of market trends, allowing traders to interpret price action more effectively with minimal lag and distraction.
⚪ What is Arithmetic Candlesticks
Arithmetic Candlesticks use a calculation method rooted in the idea that the market moves in patterns that can be identified and predicted by examining past price movements.
Analyzing momentum, price action, and trend patterns is useful for traders who want to quickly scan and identify price patterns, trends, and momentum in the market. The system searches for these patterns and trends to anticipate future price movements. Traders and investors can identify trends hidden in market noise, enabling them to uncover trading opportunities that might not be immediately obvious to the naked eye.
⚪ Eliminates price noise
The Arithmetic Candlestick noise filtering function is used to reduce price noise, which is the randomness in the price movement of an asset caused by market participants trading on a short-term basis. The idea behind the filter is that it eliminates the impact of short-term fluctuations in the price, thus providing a more accurate picture of the overall trend.
█ Capturing Trends with precise chart reading
Trend moves are some of the biggest moneymakers in trading; in fact, trading in the direction of the trend reduces risk and increases profit potential. Arithmetic Candlestick helps traders do just that.
In a fast-moving and volatile market characterized by high-frequency algorithms, retail traders have a hard time distinguishing the real trend from the noise. Arithmetic Candlesticks are designed to filter out the noise created by insignificant price moves and leave traders with the price action that matters, namely a clear and insightful chart reading. Due to its sophisticated mathematical calculations, Arithmetic Candlesticks are able to analyze any market and timeframe.
█ How to use Arithmetic Candlesticks
Arithmetic Candlesticks is an all-in-one trend and momentum tool that can be used stand-alone or in conjunction with other indicators. Its primary use is to provide a clear chart reading, easily identify trends, and help traders stay longer in trends.
The indicator includes excellent momentum features that offer insights into the current momentum and the strength of the price action. This provides traders with a unique chart experience that yields valuable insights. The indicator boasts numerous features, each of which can be used stand-alone or in combination with others. Read more about the features below.
These candles can be used in conjunction with other indicators such as support/resistance, trendlines, ICT trading, and other patterns.
█ Arithmetic Candlesticks features
The indicator comes with tons of great features that make the indicator into its own system that can be used stand-alone. You find everything from trend reading, entry/exit points, identifying momentum, and auto-stop loss.
⚪ Candle Modes:
Traders can select from three different types of arithmetic candle calculations and enable our volatility-adjusted filter for all of them. By default, the candles are set to Arithmetic candlesticks. However, depending on their trading preferences, users can select Arithmetic + Heikin Ashi Candles or Impulse + Wicks Candles.
The Heikin Ashi mode of the candlesticks makes the indicator smoother and more trend-friendly.
The Impulse + Wick mode of the candlesticks makes the indicator responsive to momentum. The length of the wicks represents the strength of the current momentum. The longer the wicks, the greater the momentum in the market.
If traders enable the Volatility Adjusted candles , the indicator becomes much more responsive to volatility moves, which is a way of making the candlesticks more responsive to significant price movements.
⚪ Trend coloring
Arithmetic candlesticks come in three different color modes: the default one, the gradient one, and the advanced trend coloring. Enable the Trend coloring if you want to engage in long-term trend trading. This filter does not change the arithmetic candlesticks, only the bar coloring.
⚪ Buy and Sell signals
To make trend trading easier to understand, we have included Buy/Sell signals. These signals are based both on the type of candlesticks selected and the type of coloring used. In addition, they come with three filters and are available in scalping and trend modes.
Candle Color Filter: A buy signal will only occur if the candlesticks are bullish, and a sell signal will only occur if the candlesticks are bearish.
Trend Tracker Filter: A buy signal will only occur if the Trend Tracker is bullish, and a sell signal will only occur if the Trend Tracker is bearish.
When both filters are applied, it means that both the candle color and the Trend Tracker should have the same sign in order to trigger a signal.
These filters are very effective and should be used when utilizing the signals.
Take Profit signals can be enabled to help traders know when to take profits.
Adaptive Stop Loss can be enabled for the signals, helping traders manage their risk.
⚪ Trend Tracker
The Trend Tracker line provides insights about the underlying trend. Adjust it if you want to engage in scalping, which makes the line much more responsive. Set the underlying speed of the trend to either Fast or Slow. This Trend Tracker works well in conjunction with Arithmetic Candlesticks and the associated signals.
⚪ Trend Sentiment
Enable Trend Sentiment to identify the levels at which the market is considered bullish or bearish. This feature helps you gauge the overall market direction, allowing you to align your trades with the prevailing trend. The Trend Sentiment also measures the strength of the trend, highlighting whether the current price action reflects a strong or weak trend. Adjust the sensitivity to determine how early or late you want to capture these trend signals.
⚪ Impulse
Enable Impulse Signals to understand when the market is making a significant move, often leading to a pullback or pause. These Impulse Signals can indicate the very start of a trend or serve as the first sign of a reversal. Enable 'Significant Impulses' if you only want to display the most significant market impulses.
█ How is Arithmetic Candlesticks Calculated?
⚪ Candlesticks
These candlesticks combine advanced smoothing techniques with price pattern recognition, giving traders a clearer view of market dynamics.
Adaptive Smoothing: The core of this smoothing approach is its ability to adjust dynamically based on market conditions. It reduces lag while staying responsive to price changes. This adaptive nature allows the candlesticks to follow the price action smoothly, minimizing the influence of short-term fluctuations. As a result, the trend is depicted with greater accuracy, helping traders to stay in tune with the market’s true direction.
Refined Smoothing with Weighted Averages: Another key component of the smoothing process involves applying a refined technique that uses a bell-shaped curve to weight price data. This method reduces the impact of outlier movements, resulting in a smoother, more continuous curve that accurately represents the market's central trend. This ensures that the candlesticks reflect a more balanced view of price action, focusing on the significant movements while filtering out unnecessary noise.
⚪ Trend Coloring
The Trend Coloring feature offers a powerful visualization tool that helps traders quickly identify the prevailing market trend and its strength. By analyzing market structure and the velocity of price movements, this feature provides a clear, dynamic view of the long-term trend direction.
Market Structure Analysis: The Trend Coloring is rooted in a thorough analysis of market structure, focusing on key price levels over time. By evaluating these levels, the system determines whether the market is in an uptrend, downtrend, or ranging phase. This information is then used to color the chart according to the current trend direction, providing a visual cue that makes it easier to align your trades with the broader market movement.
Velocity of Price Movements: . In addition to identifying the trend direction, the system also calculates the velocity of price movements. This involves assessing how quickly or slowly prices are advancing in a particular direction, offering deeper insight into the trend's strength and momentum. Faster price movements suggest a stronger trend, while slower movements may indicate a weakening or consolidating market. This dynamic approach ensures that the Trend Coloring not only highlights the trend but also reflects its intensity and potential sustainability.
⚪ Buy and Sell signals
The Buy/Sell signals are generated using a sophisticated approach that tracks key price action levels to determine market direction and momentum. This method constantly evaluates the relationship between the current price and dynamically adjusting levels that reflect the underlying market conditions. By staying in tune with the flow of the market, this approach effectively captures the onset of new trends while reducing the lag typically associated with traditional indicators.
Dynamic Price Action Levels: The signals are based on critical price action levels that adapt in real-time to market movements. These levels serve as flexible thresholds that help identify potential buy or sell opportunities. When the price interacts with these levels, it triggers signals that indicate possible entry or exit points, aligning your trades with the prevailing market direction.
Price Patterns: The algorithm also recognizes and integrates specific price patterns that are often precursors to significant market moves. By identifying these patterns, the system can anticipate changes in market direction more accurately, enabling earlier and more precise signals. This helps in capturing trend reversals or continuations effectively.
Momentum-Driven Adjustments: The system's price action levels are not static; they adjust dynamically in response to strong price movements. This ensures that the signals are not only timely but also in sync with the underlying market momentum, making the system highly effective in volatile conditions where quick decision-making is crucial.
⚪ Trend Tracker
The Trend Tracker utilizes the core principles of Arithmetic Candlesticks, including their sophisticated smoothing techniques and pattern recognition capabilities. By leveraging these features, the Trend Tracker effectively filters out market noise, allowing it to present a smooth and accurate representation of the current trend. This makes it easier to identify whether the market is trending upwards, downwards, or entering a period of consolidation.
Adaptive to Market Conditions: The Trend Tracker is not static; it dynamically adjusts as market conditions change. Whether the market is experiencing high volatility or moving through a quieter phase, the Trend Tracker remains responsive, continuously updating to reflect the most recent price action. This ensures that traders are always working with the most relevant information, making it easier to stay in sync with the market's true direction.
⚪ Trend Sentiment
Trend Sentiment analyzes key price levels and market structure to determine whether the current market sentiment is bullish or bearish. By examining the direction and momentum of price movements, it provides a straightforward view of the market's overall trend direction.
⚪ Impulse
Impulse monitors the market for sudden shifts in momentum, recognizing when the price is making a strong move that could lead to a trend continuation or a reversal. The feature is tuned to distinguish between regular market fluctuations and significant impulses. It focuses on the most meaningful price movements, ensuring that the signals you receive are relevant and actionable.
█ Important Note
Caution! Arithmetic candlesticks do not always reflect the actual price. Arithmetic uses smoothing and noise filtering to capture trends; hence, it might deviate from the actual close.
It's important to understand that Arithmetic Candlesticks are intended to provide a clearer picture of trend direction rather than exact price levels. Therefore, they should not be used as a substitute for actual market prices, especially in scenarios like backtesting or precise trade execution where exact price data is crucial. Instead, use Arithmetic Candlesticks as a tool for understanding trends and overall market direction, while relying on actual price data for decisions that require precise price points.
-----------------
Disclaimer
The information contained in my Scripts/Indicators/Ideas/Algos/Systems does not constitute financial advice or a solicitation to buy or sell any securities of any type. I will not accept liability for any loss or damage, including without limitation any loss of profit, which may arise directly or indirectly from the use of or reliance on such information.
All investments involve risk, and the past performance of a security, industry, sector, market, financial product, trading strategy, backtest, or individual's trading does not guarantee future results or returns. Investors are fully responsible for any investment decisions they make. Such decisions should be based solely on an evaluation of their financial circumstances, investment objectives, risk tolerance, and liquidity needs.
My Scripts/Indicators/Ideas/Algos/Systems are only for educational purposes!
Bezahltes Script

Kenji 2.0KenJi 2.0
Class : average analysis/trend following
Trading type : any
Time frame : any
Purpose : work in trend
Level of aggressiveness : any
About Kenji
The Kenji 2.0 indicator represents a fresh perspective on average analysis. Traditional trading strategies and indicators reliant on average analysis often generate a lot of false signals, particularly in flat market conditions characterized by frequent average crossovers and directional changes. Consequently, their efficacy and potency are compromised.
The "Kenji" Indicator overcomes these limitations through a unique algorithm (based on combination of correlation analysis and moving average analysis) designed to circumvent common pitfalls associated with average analysis. By accurately identifying the current market state—indicated by color (red for a downward trend, blue for an uptrend, and green for a flat market)—the Kenji indicator enhances signal quality, enabling traders to navigate local trends comfortably.
This indicator not only generates signals for entering positions at optimal times but also provides guidance on profit-taking. Additionally, it assists in assessing signal aggressiveness, making it a valuable tool for both novice and experienced traders.
Rules of Trading
The rules of trading with the indicator are very simple: when the price enters the buy/sell zone (depicted by a blue/red colored area between the fast and slow averages), a signal to enter a position is generated. This position remains valid until either the market state changes (e.g., a shift from a downtrend to a flat or an uptrend) or a signal to close it appears (indicated by a blue/red cross, signaling a significant divergence between the price and average values).
Structure of the Indicator
The indicator comprises colored zones and level lines:
- Colored zones (marked blue, red, or green) are utilized for identifying trading opportunities and detecting entry points.
- Level lines (marked red and blue depending on the current price direction) are employed to identify whether the current price direction is upward or downward.
To streamline the trading process, the indicator displays "buy" and "sell" signals on the chart.
These signals are categorized into two groups: standard (trading with the basic lot size) and aggressive (trading with double the basic lot size). Additionally, take-profit zones are visualized on the chart using blue/red x-crosses. Red x-crosses indicate zones where profits on "sell" positions should be taken, while blue x-crosses indicate zones where profits on "buy" positions should be taken.
Input Parameters of the Indicator
The indicator utilizes several input parameters for configuration:
Slow Average Period: This parameter determines the period of the slow average. A larger period results in a more conservative response of the average to price changes.
Fast Average Period: This parameter determines the period of the fast average. Similar to the slow average period, a larger period leads to a more conservative response of the average to price changes.
Correlation Period: This parameter is utilized in correlation analysis to calculate the level of interconnection between the averages.
Stop Sensitivity: This parameter determines the take-profit zones displayed on the chart in the form of red/blue x-crosses. A higher parameter value corresponds to a larger take-profit value.
Version 2.0 updates:
Alerts and Notifications are added ("sell" and "buy" signals are sent as Alerts and Notifications).
Improved vizualisation
Improved algorithm (mechanics of stop-loss marks in modified)
Access to the indicator
Please address all questions about this indicator (including access to it) in private messages.

Price & Volume Breakout Fibonacci Probability [TradeDots]📝 OVERVIEW
The "Price & Volume Breakout Fibonacci Probability" indicator is designed to detect the probability of the maximum run-up and drawdown of each breakout trade on an asset, assisting traders in optimizing their take profit and stop loss strategies.
🧮 CALCULATIONS
The algorithm detects price and volume breakouts to activate the Fibonacci levels displayed on the chart. It calculates these levels using the period pivot high and low, with the close price of the breakout bar as the reference price.
The indicator then forward-tests within an user-selected number of bars, detecting the maximum run-up and drawdown during that period. Consequently, it calculates the probability of the price hitting either side of the Fibonacci levels, showing the likelihood of reaching take profit and stop loss targets for each breakout trade.
📊 EXAMPLE
The above example shows two breakout trades, circled within the yellow rectangle zone.
The first trade has a maximum run-up above the +0.382 Fibonacci level zone and a maximum drawdown below the -0.618 Fibonacci level zone.
When the price reaches the maximum run-up, it only has a ~45% probability of moving further upward into the last two zones (25% + 19.44%). This indicates that setting a take profit at a higher level may have less than a 50% chance of success.
Conversely, when the price reaches its maximum drawdown, there is only an ~8% probability of moving further downward into the last drawdown zone. This could indicate a potential reversal.
⚙️ SETTINGS
Breakout Condition: Determines the type of breakout condition to track: "Price", "Volume", "Price & Volume".
Backtest Period: The maximum run-up and drawdown are detected within this bar period.
Price Breakout Period: Specifies the number of bars the price needs to break out from.
Volume Breakout Period: Specifies the number of bars the volume needs to break out from.
Trendline Confirmation: Confirms that the close price needs to be above the trendline.
📈 HOW TO USE
By understanding the probabilities of price movements to both the upside and downside, traders can set take profit and stop loss targets with greater accuracy.
For instance, placing a stop loss order below the zone with the highest probability minimizes the chances of being stopped out of a profitable trade. Conversely, setting a take profit target at the zone with the highest probability increases the win rate.
Additionally, if the price breaches multiple Fibonacci levels during the breakout period, it may indicate an abnormal state, signaling a potential reversal or pullback. This can help traders exit trades in a timely manner.
Traders can adjust their take profit and stop loss levels based on their individual risk tolerance.
RISK DISCLAIMER
Trading entails substantial risk, and most day traders incur losses. All content, tools, scripts, articles, and education provided by TradeDots serve purely informational and educational purposes. Past performances are not definitive predictors of future results.

Pace ProOverview
The Pace Pro indicator is a robust trend-following tool designed for versatile application across various timeframes and markets, including stocks, forex, futures and cryptocurrencies. It provides traders with "bull" and "bear" signals, take profit (TP) signals, and volume spike indications. This indicator aims to help traders identify potential trading opportunities through trends, reversals and price exhaustion.
Key Features
Bull and Bear Signals: Pace Pro generates green "bull" and red "bear" signals based on a trend strength score derived from an aggregation of components.
Take Profit (TP) Signals: The indicator plots black "TP" signals at areas of price exhaustion.
Volume Spike Indicators: The indicator colors candles to signify high volume spikes—light green for high bullish volume and light red for high bearish volume.
Price Clouds: The indicator includes three types of Bollinger Band clouds. These clouds help visualize exhaustion and volatility, providing traders with multiple perspectives on market dynamics.
How it works:
Trend Strength: This score is calculated using a proprietary formula that assesses the magnitude and direction of market movement with standard deviation and regression analysis. Standard deviation computes the average price over a specified period and then calculates the standard deviation of prices from this average. A linear regression is performed on the closing prices over a specified period. The slope of the regression line is used to identify the trend direction, and the standard deviation is used to assess trend stability and filter out noise, working together to clearly identify direction and robustness. Bull/Bear signals are produced based on trend strength reaching specific thresholds, configurable in the settings.
Overbought/Oversold Strength: This strength identifies price exhaustion using a unique formula that aggregates values from several indicators such as RVI, RSI and CCI. RVI captures price trends, RSI measures momentum, and CCI identifies price deviations from the mean, providing a comprehensive view of market conditions. Take profit signals are plotted at points of high price exhaustion, indicating optimal exit prices.
Volume Analysis: Volume spikes are identified and highlighted with colored candles using an ATR calculation that pinpoints outliers in volume. This is calculated using the math.abs function, identifying volume spikes in the last 14 bars. Volume spike candle size can be configured in settings to the user's liking.
Bollinger Band Clouds: The indicator employs Bollinger Band clouds based on WMA, VWMA, and EMA to provide a comprehensive view of market volatility and trend strength. WMA responds quickly to price changes, VWMA incorporates volume, and EMA smooths out data, offering a unique and adaptive perspective on market conditions. This combination is used to provide a unique perspective on market volatility, utilizing different moving averages. These clouds adapt to price fluctuations and offer visual cues to enhance trend analysis.
Utility
This tool provides traders with valuable information for trend-following and reversal strategies across different timeframes. It helps traders by:
-Generating "bull" and "bear" signals to indicate potential long, short and exit points. The precise calculation methods and statistical components used in deriving the trend strength score are designed to filter out market noise and provide a clear indication of prevailing market trends.
-Providing "TP" signals at areas of price exhaustion, areas where taking profit is optimal. These also serve as potential reversal points in the market as they incorporate reversion analysis techniques.
-Highlighting high volume spikes with colored candles to indicate significant market activity. These volatile candles can indicate a significant and rapid surge in price.
-Offering visual insights through Bollinger Band clouds, which help traders assess overbought and oversold conditions on a broad scale. These aid in visualizing potential reversals in the market.
Rationale and Benefits of Component Combination
The combination of trend strength, overbought/oversold strength, volume analysis, and Bollinger Band clouds provides a holistic approach to market analysis and allows users to use various techniques of trading analysis to make sound trading decisions. Each component serves a distinct purpose:
-Trend Strength identifies and confirms the direction and magnitude of market trends, offering clear bull and bear signals. A trend score is calculated to clearly identify where price is strongly trending and where it is quite weak. This customizable feature allows traders to configure this indicator to their liking by only plotting signals when the trend reaches a desired threshold.
-Overbought/Oversold Strength pinpoints areas of price exhaustion, providing crucial take profit and reversal conditions in the market. I combine RSI, RVI, and CCI to provide a more robust reversion score. My rationale for this is to leverage data from multiple indicators, to ensure a comprehensive assessment of price exhaustion rather than relying on a single source.
-Volume Analysis highlights significant market activity, giving traders insights into potential price movements. This feature is included to provide users with a visual representation of price pumps/dumps, that can aid in trading decisions in combination with entry and exit signals.
-Bollinger Band Clouds offer a visual representation of market volatility and trend strength, enhancing the overall analytical framework. Bands were calculated using a mixture of WMA, VWMA, and EMA to diversify data and to bring variety to its display. This can enhance its use as it does not use a single data source and relies on multiple.
Uniqueness:
This indicator stands out due to its innovative integration of standard deviation and regression analysis, offering traders a unique and comprehensive market analysis tool. By combining standard deviation to measure volatility and filter out noise with regression analysis to identify trend direction and strength, it provides insightful trend signals that help traders make informed decisions. This indicator's versatility is enhanced by its customizable settings, allowing traders to adapt it to their specific needs and trading styles with the trend sensitivity setting. Combining RSI, RVI, and CCI for reversion and exit points is unique as it integrates multiple perspectives on price momentum and volatility, providing a more comprehensive assessment of price exhaustion than using any single indicator. Combining WMA, EMA, and VWMA as bands is beneficial and unique as it blends different averaging methods to offer a more nuanced and adaptive view of market volatility and trend strength.
By integrating these components, it delivers a multifaceted tool that addresses various aspects of market analysis, making it a valuable asset for traders seeking to improve their decision-making process.
Disclaimer
Trading involves substantial risk and is not suitable for every investor. This indicator is designed to assist in decision-making but does not guarantee profits or prevent losses. Always conduct your own research and consider seeking advice from a financial professional.
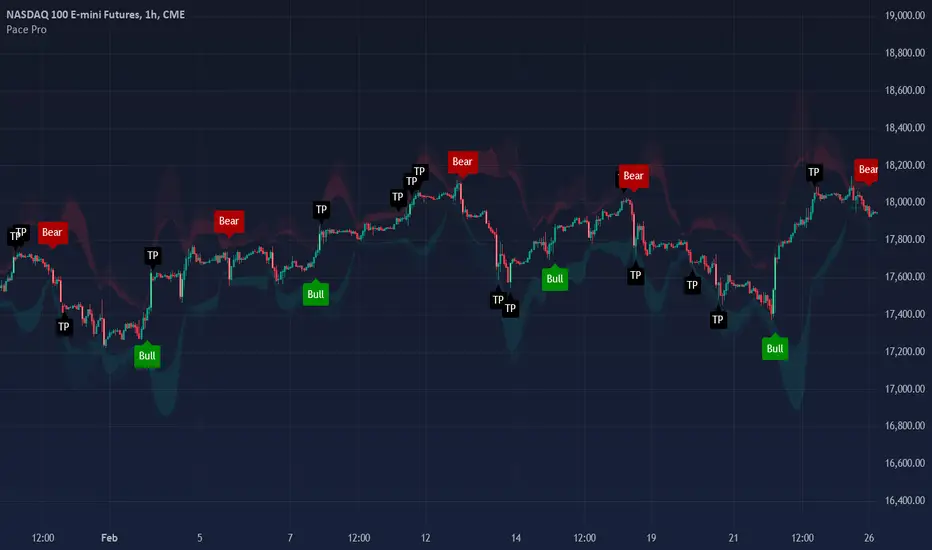
Lot Size Calculator [SCRIPTS INVERSIONES]1. Balance (USD)
Description: This input allows you to set your trading account balance in USD. The balance is used to calculate the amount of money you are risking on a trade.
How to Use: Enter the total balance of your trading account. For example, if you have $1,000 in your account, you would input 1000.
2. Leverage
Description: Leverage multiplies your purchasing power, allowing you to control a larger position than your account balance would normally allow.
How to Use: Set the leverage level you are using. For example, if your broker offers 20x leverage, you would input 20. This will affect the size of your positions and the potential risk and reward.
3. Risk Percentage (%)
Description: This is the percentage of your account balance that you are willing to risk on a single trade.
How to Use: Enter the percentage of your balance you want to risk. For instance, if you want to risk 1% of your $1,000 balance, you would input 1. The script will then calculate the maximum amount of money you can lose on the trade.
4. Stop Loss Percentage (%)
Description: This is the percentage distance from your entry price at which your Stop Loss (SL) will be set.
How to Use: Input the percentage you want for the Stop Loss. For example, if you want the SL to be set 1% below the entry price, you would input 1. This is used when not in manual or ATR mode.
5. Take Profit Percentage (%)
Description: This is the percentage distance from your entry price at which your Take Profit (TP) will be set.
How to Use: Input the percentage for the Take Profit. For example, if you want the TP to be set 2% above the entry price, you would input 2. This is used when not in manual or ATR mode.
6. ATR Multiplier
Description: The Average True Range (ATR) is a measure of volatility, and this multiplier adjusts how far your Stop Loss and Take Profit are set based on ATR.
How to Use: If you're using ATR mode, set the multiplier to adjust the distance of your SL and TP. For example, if the ATR is 10 and you set a multiplier of 1.5, the SL and TP will be set 15 units away from the entry price.
7. Long Trade?
Description: This option determines whether your trade is a "Long" (buy) or "Short" (sell) position.
How to Use: Select true if you are going long (expecting the price to rise), or false if you are going short (expecting the price to fall). This will influence how the SL and TP are calculated.
8. Manual Mode?
Description: In Manual Mode, you can manually input an entry price instead of using the current market price for calculations.
How to Use: Enable this mode by setting it to true if you want to manually enter a specific price. You will then need to input your desired entry price in the "Manual Price" field.
9. ATR Mode?
Description: When ATR Mode is enabled, the script uses the ATR to calculate Stop Loss and Take Profit levels instead of using fixed percentages.
How to Use: Enable this mode by setting it to true to calculate SL and TP based on ATR. The SL and TP will then be adjusted automatically based on market volatility.
How to Use the Script with Different Modes
Automatic Mode with Percentages:
When to Use: If you want SL and TP to be set as a fixed percentage of the entry price.
Setup: Set Manual Mode to false and ATR Mode to false. Input your desired percentages for SL and TP.
Manual Mode:
When to Use: If you want to manually set the entry price and calculate SL and TP based on that price.
Setup: Set Manual Mode to true. Enter the manual price you want to use for calculations in the "Manual Price" field. SL and TP will be calculated based on this price.
ATR Mode:
When to Use: If you want SL and TP to adjust automatically based on market volatility.
Setup: Set ATR Mode to true and adjust the ATR Multiplier according to your preference. SL and TP will be set according to the ATR value multiplied by the chosen multiplier.
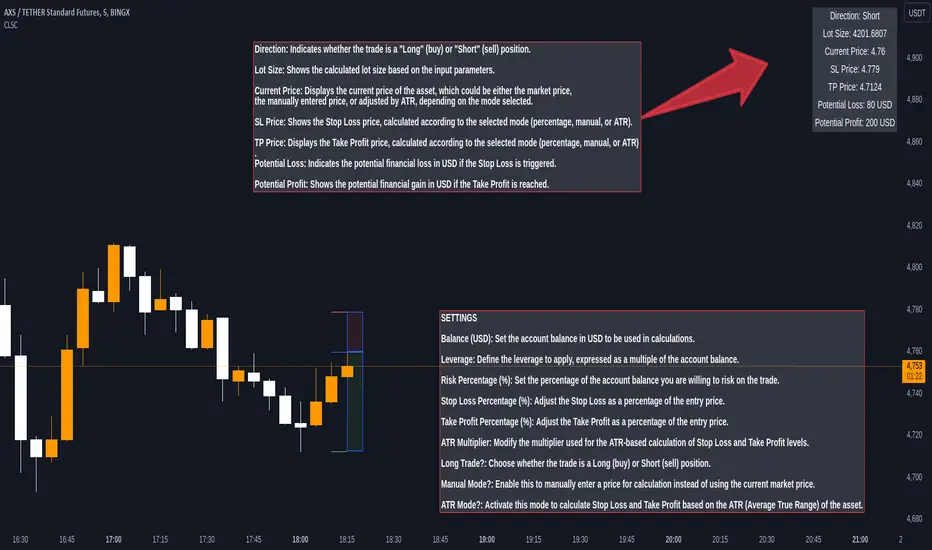
Reversal Finder [SMRT Algo]The Reversal Indicator is designed for traders who use contrarian strategies, focusing on identifying potential reversal points in the market. This indicator leverages mean and deviation calculations, along with bar pattern movements, to provide insights into price movements and potential turning points.
Features:
The Reversal Indicator is tailored for contrarian trading, which involves taking positions against the trend to capitalize on potential reversals. This approach is inherently riskier, as it aims to identify precise highs and lows in the market.
Configurable Sensitivity: Traders can adjust the sensitivity of the indicator, which determines how many confirmation candles are required before a signal is generated. Higher sensitivity values mean more confirmation candles, resulting in later but more reliable signals. This feature allows traders to balance between early entries and signal accuracy.
Separate Buy & Sell Sensitivities: Buy and sell sensitivities can be adjusted separately which provides greater flexibility, enabling traders to fine-tune the indicator based on market conditions or personal trading preferences.
Reversal Bands: The indicator features color-coded bands (green, yellow, red) that represent different levels of price overextension. The dynamic nature of these bands, which adjust based on real-time market data, provides a constantly updated visual representation of potential reversal zones.
- Green Band: Indicates the initial phase where price is starting to get overextended.
- Yellow Band: Suggests a moderate level of overextension.
- Red Band: Signals a high likelihood of reversal due to significant overextension.
Signal Generation: The indicator only searches for buy or sell signals when the price enters these reversal bands, thereby focusing on zones with a higher probability of a reversal.
Take Profit (TP) & Stop Loss (SL) Features: The indicator includes predefined TP and SL levels, calculated based on a risk-to-reward ratio with respect to the stop loss. For instance, TP1 corresponds to a 1:1 ratio, up to TP3, allowing traders to manage risk effectively and set realistic profit targets.
Band-Based Take Profit: In addition to standard TP levels, traders can use the reversal bands themselves as take profit zones, targeting the green, yellow, or red areas to close trades. This dual-layered approach provides more nuanced trade management options.
Alert System: The indicator allows traders to set alerts for when signals are generated, ensuring they do not miss potential trading opportunities.
A signal is generate when we have x-consecutive bullish/bearish bars for a buy or sell signal respectively. This is what the 'Sensitivity' input controsl for in the settings. A signal is only generated when price enters the deviation bands, as those are areas where a reversal is of higher probability.
The Reversal indicator uses mean and deviation calculations, which are fundamental to the Reversal Indicator, providing a statistical baseline for identifying overextended price movements. By measuring how far price deviates from its mean, the indicator identifies conditions where a reversal is more likely. This statistical foundation ensures that the signals are based on objective data, rather than subjective judgment.
The integration of bar pattern analysis with mean and deviation calculations allows the indicator to add a layer of context to the raw data. Bar patterns are used to confirm potential reversals by analyzing the formation of candles and the overall structure of the price action. This component enhances the accuracy of signals by ensuring they are not only statistically significant but also contextually relevant.
The Reversal Indicator’s unique sensitivity adjustment feature allows traders to fine-tune the responsiveness of the signals. This flexibility means the indicator can be adapted to various market conditions, enhancing its utility across different trading environments. The separate adjustment for buy and sell sensitivities further allows traders to customize the indicator based on their specific trading strategies, whether they are more conservative or aggressive in their approach.
The Reversal Indicator's unique combination of statistical and pattern-based analysis, customizable settings, and dynamic real-time components offers significant added value compared to standard indicators.
The SMRT Algo Suite, which the Reversal Finder is a part of, offers a comprehensive set of tools and features that extend beyond the capabilities of standard or open-source indicators, providing significant additional value to users.
What you also get with the SMRT Algo Suite:
Advanced Customization: Users can customize various aspects of the indicator, such as toggling the confirmation signals on or off and adjusting the parameters of the MA Filter. This customization enhances the adaptability of the tool to different trading styles and market conditions.
Enhanced Market Understanding: The combination of pullback logic, dynamic S/R zones, and MA filtering offers traders a nuanced understanding of market dynamics, helping them make more informed trading decisions.
Unique Features: The specific combination of pullback logic, dynamic S/R, and multi-level TP/SL management is unique to SMRT Algo, offering features that are not readily available in standard or open-source indicators.
Educational and Support Resources: As with other tools in the SMRT Algo suite, this indicator comes with comprehensive educational resources and access to a supportive trading community, as well as 24/7 Discord support.
The educational resources and community support included with SMRT Algo ensure that users can maximize the indicators’ potential, offering guidance on best practices and advanced usage.
SMRT Algo believe that there is no magic indicator that is able to print money. Indicator toolkits provide value via their convinience, adaptibility and uniqueness. Combining these items can help a trader make more educated; less messy, more planned trades and in turn hopefully help them succeed.
RISK DISCLAIMER
Trading involves significant risk, and most day traders lose money. All content, tools, scripts, articles, and educational materials provided by SMRT Algo are intended solely for informational and educational purposes. Past performance is not indicative of future results. Always conduct your own research and consult with a licensed financial advisor before making any trading decisions.

Chieu - Bollinger Bands SMA 50 StrategyOverview
The Custom Bollinger Bands Indicator is a versatile tool designed to help traders identify potential market reversals and optimize their trading strategies. This indicator combines Bollinger Bands with an ATR-based stop-loss mechanism, configurable take-profit levels, and dynamic position sizing to manage risk effectively. By highlighting key market conditions and providing clear visual cues, it enables traders to make informed decisions and execute trades with precision.
Key Features
Bollinger Bands Calculation:
The indicator calculates Bollinger Bands based on a configurable Simple Moving Average (SMA) length.
Standard deviation multiplier is adjustable, allowing traders to fine-tune the width of the bands.
Candlestick Highlighting:
Candles that touch the upper or lower Bollinger Bands are highlighted, indicating potential overbought or oversold conditions.
Reversal candles are identified and highlighted based on specific criteria:
The candle must touch the Bollinger Bands for two consecutive periods.
The reversal candle must have a body at least twice the size of the previous candle's body.
The reversal candle must close in the opposite direction to the previous candle (e.g., a bullish candle following a bearish one).
Stop-Loss and Take-Profit Levels:
Stop-loss levels are calculated using the ATR (Average True Range) indicator, ensuring they are dynamically adjusted based on market volatility.
Two configurable take-profit levels (1R and 2R) are plotted based on the initial risk (distance between entry and stop-loss).
Take-profit and stop-loss lines are visually represented on the chart for easy reference.
Position Sizing and Risk Management:
The indicator includes configurable inputs for account balance, leverage, and risk percentage.
It calculates the nominal value (position size without leverage) and cost value (position size with leverage) based on the specified risk parameters.
Combined labels display SL, TP, nominal value, and cost value, replacing the default "Reversal" text for clear, concise information.
Customization Options:
Users can configure the length of the take-profit lines.
The option to toggle the highlighting of candles touching the Bollinger Bands on or off, while always highlighting the identified reversal candles.
How to Use
Configuration:
Set the desired SMA length and Bollinger Bands multiplier in the input settings.
Configure the ATR length for accurate stop-loss calculations.
Adjust the risk-reward ratio and take-profit line length according to your trading strategy.
Specify your account balance, leverage, and risk percentage for precise position sizing.
Chart Analysis:
Monitor the chart for candles touching the upper or lower Bollinger Bands. These highlights indicate potential overbought or oversold conditions.
Look for highlighted reversal candles, which meet the specified criteria and suggest a potential market reversal.
Use the plotted stop-loss and take-profit lines to manage your trades effectively. The combined labels provide all necessary information (SL, TP, nominal value, and cost value) for quick decision-making.
Execution and Risk Management:
Enter trades based on the reversal candle signals.
Set your stop-loss at the indicated level using the ATR calculation.
Take partial profits at the first take-profit level (1R) and adjust your stop-loss to the entry point to secure the remaining position.
Exit the trade entirely at the second take-profit level (2R) or if the price returns to the adjusted stop-loss level.
Improved Volume Based Indicator# Improved Volume Based Indicator
## Overview
The Improved Volume Based Indicator is a technical analysis tool designed to identify potential trading opportunities based on volume patterns, price action, and trend direction. This indicator combines volume analysis with moving averages and the Average True Range (ATR) to generate buy and sell signals.
## Key Components
1. Volume Analysis
- Tracks consecutive volume direction (up or down) for 3 periods
- Calculates volume ratio compared to a short-term moving average
2. Trend Direction
- Uses a 200-period Exponential Moving Average (EMA) to determine overall trend
3. Volatility Measurement
- Incorporates the Average True Range (ATR) for stop-loss and take-profit calculations
## Signal Generation
### Buy Signal Criteria
1. Three consecutive periods of up volume (close > open)
2. Volume ratio > 1.5 (current volume is 50% higher than the short-term average)
3. Current price is above the 200 EMA
### Sell Signal Criteria
1. Three consecutive periods of down volume (close < open)
2. Volume ratio > 1.5 (current volume is 50% higher than the short-term average)
3. Current price is below the 200 EMA
## Risk Management
The indicator calculates stop-loss and take-profit levels based on the ATR:
- Stop Loss: ATR * 1.5 (default)
- Take Profit: ATR * 2.5 (default)
These levels are adjustable through input parameters.
## Usage
1. Add the indicator to your chart
2. Adjust input parameters as needed:
- Volume Period (2-5)
- ATR Period (default 14)
- ATR Multipliers for Stop Loss and Take Profit
- EMA Period (default 200)
3. Monitor for buy and sell signals
4. Use the provided stop-loss and take-profit levels for risk management
## Interpretation
- Buy signals suggest potential upward price movement
- Sell signals suggest potential downward price movement
- Always consider other factors and perform additional analysis before making trading decisions
## Limitations
- This indicator may generate false signals in choppy or ranging markets
- It's best used in conjunction with other technical analysis tools and fundamental analysis
- Past performance does not guarantee future results
Remember to thoroughly test this indicator on historical data and in various market conditions before using it in live trading.
---
# 改進的基於交易量的指標
## 概述
改進的基於成交量的指標是一種技術分析工具,旨在根據成交量模式、價格行為和趨勢方向識別潛在的交易機會。此指標將成交量分析與移動平均線和平均真實波動幅度 (ATR) 結合起來,以產生買入和賣出訊號。
## 關鍵部件
1. 成交量分析
- 追蹤 3 個週期的連續成交量方向(向上或向下)
- 計算與短期移動平均線相比的成交量比率
2. 趨勢方向
- 使用 200 週期指數移動平均線 (EMA) 來確定整體趨勢
3. 波動率測量
- 納入平均真實波動範圍 (ATR) 以進行停損和停盈計算
## 訊號生成
### 購買訊號標準
1. 連續三個週期的成交量上漲(收盤>開盤)
2.成交量比率>1.5(目前成交量較短期平均高50%)
3. 當前價格高於200 EMA
### 賣出訊號標準
1.連續三個週期的成交量下跌(收盤<開盤)
2.成交量比率>1.5(目前成交量較短期平均高50%)
3. 目前價格低於200 EMA
## 風險管理
此指標根據 ATR 計算停損和止盈水準:
- 停損:ATR * 1.5(預設)
- 止盈:ATR * 2.5(預設)
這些等級可透過輸入參數進行調整。
## 用法
1. 將指標加入您的圖表中
2. 根據需要調整輸入參數:
- 卷期 (2-5)
- ATR 週期(預設 14)
- 用於停損和止盈的 ATR 乘數
- EMA 週期(預設 200)
3. 監控買賣訊號
4. 使用提供的停損和停利水準進行風險管理
## 解釋
- 買進訊號表示價格可能上漲
- 賣出訊號表示價格可能下跌
- 在做出交易決策之前始終考慮其他因素並進行額外分析
## 限制
- 此指標可能會在波動或波動的市場中產生錯誤訊號
- 最好與其他技術分析工具和基本面分析結合使用
- 過去的表現並不能保證未來的結果
請記住,在實際交易中使用該指標之前,請根據歷史數據和各種市場條件徹底測試該指標。

Sniper Entry using RSI confirmationThis is a sniper entry indicator that provides Buy and Sell signals using other Indicators to give the best possible Entries (note: Entries will not be 100 percent accurate and analysis should be done to support an entry)
Moving Average Crossovers:
The indicator uses two moving averages: a short-term SMA (Simple Moving Average) and a long-term SMA.
When the short-term SMA crosses above the long-term SMA, it generates a buy signal (indicating potential upward momentum).
When the short-term SMA crosses below the long-term SMA, it generates a sell signal (indicating potential downward momentum).
RSI Confirmation:
The indicator incorporates RSI (Relative Strength Index) to confirm the buy and sell signals generated by the moving average crossovers.
RSI is used to gauge the overbought and oversold conditions of the market.
A buy signal is confirmed if RSI is below a specified overbought level, indicating potential buying opportunity.
A sell signal is confirmed if RSI is above a specified oversold level, indicating potential selling opportunity.
Dynamic Take Profit and Stop Loss:
The indicator calculates dynamic take profit and stop loss levels based on the Average True Range (ATR).
ATR is used to gauge market volatility, and the take profit and stop loss levels are adjusted accordingly.
This feature helps traders to manage their risk effectively by setting appropriate profit targets and stop loss levels.
Combining the information provided by these, the indicator will provide an entry point with a provided take profit and stop loss. The indicator can be applied to different asset classes. Risk management must be applied when using this indicator as it is not 100% guaranteed to be profitable.
Goodluck!

Position Sizing Tool - Fixed Loss - Multi Asset [RSC]
This script is an Multi Asset measurement tool that can be used to evaluate or keep track of trades. Like the long and short position drawing tools, it calculates a risk reward ratio and a risk-adjusted position size from multiple entries (4 maximum), stop and take profit multiple levels ( 4 maximum) , but it also does much more:
• It can be used to configure long or short trades.
• All monetary values can be expressed in any number of currencies.
• The value of tick/pip movement (which varies with the position's size) is displayed in the currency you have selected.
• It does live tracking of the position.
• You can configure alerts on entries and exits.
█ HOW TO USE IT
Load the indicator on an active chart.
When you first load this script on a chart, you are able specify following parameter
• Account Balance
• Account currency.
And for each asset (Max 8):
• Symbols Ticker (and Exchange)
• Risk per trade (% or Amount base on Account Currency)
• Account Size
• Entry Time
• Entry levels (Max. 4)
• Leverage (only works for crypto) (same leverage for all entries)
• Stop loss level.
• Take profit level (Max. 4)
• Exit level percentage (Max. 4)
Once you have entered (or modify) parameters, the script will draw trade zones and levels labels containing the trade metrics:
• determines if the trade is a long or short from the position of the take profit and stop loss levels in relation to the entry price. If the take profit level is above the entry price, the stop must be below and vice versa, otherwise an error occurs.
• You can change levels by entering new values in the script's settings.
Once you place the position tool on a chart, it will appear at the same levels on symbols that you selected in script setting and nothing showed up for other symbols.
If your scale is not set to "Scale price chart only", the position tool's levels will be taken into account when scaling the chart, which can cause the symbol's bars to be compressed. If your scale is set to "Scale price chart only", the position tool will still be there, but it will not impact the scale of the chart's bars, so you won't see it if it sits outside the symbol's price scale.
█ FEATURES
Display
The position tool displays the following information for entries:
• The price level with “ Stoploss/Entry/Target” sign before it.
• Open or Closed P&L: For an open trade, the "Open P&L" displays the difference in money value between the entry level and the chart's current price.
For a closed trade, the "Closed P&L" displays the realized P&L on the trade.
• Quantity: The trade size, which takes into account the risk tolerance you set in the script's settings.
• RR: The reward to risk ratio expresses the relationship of the distance between the entry and the take profit level vs the entry and the stop level.
Example: A $100 stop with a $100 target will have a ratio of 1:1, whereas a $200 target with the same stop will have a 2:1 ratio.
• Per tick/pip: Represents the money value of a tick or pip movement.
• Their distance from the entry in money value, percentage and ticks/pips.
• The projected end money value of the position if the level is reached. These values are calculated based on the trade size and the currency.
█ Currency adjustments
This indicator modifies the trade label's colors and values based on the final Profit and Loss (P&L), which considers the dynamic exchange rate between base and conversion currencies in its calculations when the conversion currency is a specified value other than the default. Depending on the cross rate between the base and account currencies, this process can yield a negative P&L on an otherwise successful simulated trade.
For instance, if your account is in currency XYZ, you might buy 10 Apple shares at $150 each, with the XYZ to USD exchange rate being 2:1. This purchase would cost you 3000 units of XYZ. Suppose that later on, the shares appreciate to $170 each, and you decide to sell. One might expect this trade to result in profit. However, if the exchange rate has now equalized to 1:1, the return on selling the shares, calculated in XYZ, would only be 1700 units, resulting in a loss of 1300 units XYZ.
The indicator will mark the P&L and the target labels in red in such cases, regardless of whether the market price reached the profit target, as the trade produced a net loss due to reduced funds after currency conversion. Conversely, an otherwise unsuccessful position can result in a net profit in the account currency due to conversion rate fluctuations. The final losses or gains appear in the label metrics, and the corresponding color coding reflects the trade's success or failure.
█ Settings
The settings in the "Trade sizing" section are used to calculate the position size and the monetary value of trades. Two types of risk can be chosen from the menu; a percentage based risk calculation, or a fixed money value. The risk is used to calculate the quantity of units to purchase to achieve that level of risk exposure. Example: An account size of $1000 and 10% risk will have a projected end amount of $900 if the stop loss is hit. The quantity is a product of this relationship; a projected number of units to allow for the equivalent of $100 of risk exposure over the change in price from the entry to the stop value.
You can control the appearance of the tool and the values it displays in the settings following these first two sections.

Precision Strike Entry [PSE]This tool, known as Precision Strike Entry (PSE) , automatically generates Fibonacci Retracement Levels on any chart. More specifically, it scans for continuation and reversal trades based on two inputs and provides exact entry, exit ( Stop Loss ), and Take Profit levels.
Precision Strike Entry can be used for both Crypto and Forex markets.
A crucial aspect is adjusting the " Trading Mode " length to identify the correct extreme points or Custom Pivot Period Lookback. Unlike manually drawn Fibonacci levels, which remain static, the tool adjusts its levels dynamically when the chart's time frame changes.
Trading Mode Options:
Custom – To set manually Pivot Period Lookback
Scalper - Recommended for 5-15 min timeframes
Normal - Recommended for 15 min-2h timeframes
Swing - Recommended for 2h-4h timeframes
Unique to this tool is that the user can filter specific conditions before the Fibonacci is drawn on the chart. Additionally, it provides exact entry, stop loss, and Take Profit levels.
The identification of possible Fibonacci Retracement happens using two trigger techniques:
1-2 Setup and Trendline Break identification.
--> Using the 1-2 Setup identification, the indicator attempts to identify the next wave for point 3 using Fibonacci retracement rules.
--> Using the TrendLine breakout filter, the indicator will try to identify a possible pullback entry, utilizing Fibonacci retracement.
The indicator has been designed for bot processes, meaning it will not identify a short trade until you are in a long position and vice versa. Every trade ends with a custom breakeven at TP5 or hitting Stop Loss. When a trade ends/closes, the indicator will automatically search for a new long/short opportunity.
Since every symbol (Pair/Coin) has different conformations and pivots, not all pivot period parameters are perfect for every pair and timeframe. This is why the indicator gives you the opportunity to find the best pivot period for every combination of pair/timeframe, thanks to the Tuning Dashboard .
For example, for APE/USDT.P, by adjusting the 1-2 Setup & TrendLine Pivot Period Lookback settings, you can find a good setting with 1-2 Setup pivots set to 14, and TrendLine Breakout set to 15. The indicator checks the past 1000 bars and historical trades to provide an overview of what happened during the past 1000 bars.
In this case, the total number of trades was 145, and only 35 trades (24% of total trades) hit the Stop Loss without hitting at least TP1. TP1 was hit 110 times (75.75% of trades), TP2 65 times, etc.
This summary table also provides an indication of which pivot period setting is best for a specific pair/time frame combination. It offers statistical insights on how Take Profits were hit, giving you more confidence in how much of your position you will sell for each Take Profit level.
Pivot period settings for 1-2 Setup & Trend Line Breakout identification can be modified in the indicator parameters when the Trading Mode is set to Custom. There is also an extra parameter for filtering Long/Short ( Buy and Sell ) signals based on trend, identified using two EMAs (Moving Averages) with periods of 74 and 144.
Within the settings, you can also set Stop Loss and Breakeven settings as you prefer.
Default settings are:
TP1 Breakeven Level to Entry (possible values: Entry - DCA Entry - StopLoss)
TP2 Breakeven Level to TP1 (possible values: Entry - TP1 - StopLoss)
Breakeven Trigger: Use Close/Open of candles
Stoploss Trigger: Use Close/Open of candles
The indicator settings also include some visual settings to adapt the indicator based on the template you are using for your trading view charts for the best experience.
Alert Settings:
Precision Strike Entry (PSE) is designed to integrate with third-party bot systems
You can set three different alert modes:
TradingView Alert : You will receive classic TradingView alerts with messages indicating the desired alert, like Open Long (BUY), StopLoss Hit, Breakeven, and TakeProfits trigger alerts. (You will receive only the selected alerts from the list.)
Bot Alert : You will receive alerts only for Create Trade or Close Trade with the string of your UUID (you have to fill them in related to your Bot indication) and remember to set the Webhook setting to ensure the alert triggers on your Bot. When you use Bot Alert, you have to set the indicator Signal Type related to your Bot settings. NB: If you have created a TradingView Bot for Long Position, you will have to choose Signal Type = Long in the indicator settings.
Free Text Trade Alert : Using this setting, you will receive alerts only for Open Trade Long or Short. All information about Stop Loss and Take Profits is integrated into the Free Text Template.
Explanation for possible Fibonacci Retracement identification:
1-2 Setup identification:
Trend Line Breakout Pullback Identification:

SMC Community [algoat] — Smart Money ConceptsEmpower your trading with the core principles of the Smart Money Concepts through interactive features and highly customizable settings.
The indicator's strength lies in the unique SMC Core algorithm, a calculation based on real price action data, capturing every tick from small intraday fluctuations to significant high timeframe movements.
algoat SMC Core is our continually evolving, specialized structure mapping algorithm, serving as the backbone of our price action related publications.
⭐ Key Features
Swing Market Structure: Change of Character, Break of Structure
Recognize and visualize real-time market structures with swing elements. Identify and mark key structural changes in the market to visually highlight shifts in market trends and patterns. This feature is designed to alert you to significant changes in the market's behavior, signaling a potential shift from accumulation to distribution phases, or vice versa. It helps traders adapt their strategies based on evolving market dynamics.
Order Flow: Structure Fractal
Connect the successive structural high and low levels, visualizing the intricate flow of market movements. This feature highlights fractal structures within the market, enabling traders to detect significant price action patterns.
Structure Range: Determine Discount, Premium, and Equilibrium Zones
This feature provides a unique way of visualizing price areas where a security could be overbought or oversold (premium or discount zones) and where the price is expected to be fair and balanced (equilibrium zone). Distance from the current price is displayed in percentage terms, which can assist traders with crucial data for risk management and strategic planning. The Range function helps you identify the most favorable price zones for entries and set your stop-loss and take-profit levels more accurately.
Liquidity Grabs: Reveal Hidden Manipulation Attempts
Identify uncovered market areas where high liquidity trading may take place. Liquidity Grabs help track "smart money" footprints by identifying levels where large institutional traders may have induced liquidity traps. Understanding these traps can aid in avoiding false market moves and optimizing trade entries.
Institutional Interest Zones: Order Blocks and Fair Value Gaps
Uncover areas where bigger orders may be lined up. Reveal zones of interest ordered by volume strength. Receive warnings about market price imbalances.
▸ Order Blocks pinpoint crucial zones where large institutional investors ("smart money") have shown strong buying or selling interest recently. These blocks can serve as a tool for identifying key areas for potential trade entries or exits.
▸ Fair Value Gaps detect discrepancies between the perceived market value and the actual market price, revealing potential areas for price correction. With its mitigation settings, you can fine-tune the FVG detection according to the magnitude of value misalignment you consider significant.
Mitigation types dictate how price interacts with a zone, with order blocks requiring a close through (indicating stronger price movement) and fair value gaps requiring a wick through (hinting at weak rejection).
══════════════════
⭐ Why SMC?
In the ever-evolving trading landscape, mainstream methods and strategies can quickly become outdated as they are widely adopted. Liquidity is constantly sought after, and the best source for this is exploring and exploiting trading strategies that are widely accepted and applied. Currently, one of these strategies is the SMC (Supply, Demand, and Price Action).
It's no coincidence that our educational materials incorporate concepts such as liquidity grabs (LG) and Smart Money Traps (SMT). As the application of SMC gains popularity among retail traders, trading with this approach becomes more challenging. Therefore, the recent focus has been on reforming the SMC methodology, as it is the only method that relies on real price movements and will always work when applied correctly.
The indicator reflects our personal use and deep comprehension of Smart Money Concepts. It provides streamlined tools for tracking algorithmic trends with modern visualizations, without unnecessary clutter.
▸ What does the proper application of SMC entail?
Many SMC traders associate their key areas of interest with the market structure, which is generally considered acceptable. However, depending solely on a single foundation can lead to significant deviations, which may cause notable impacts on trading results. Moreover, if the basis for the market structure calculation is inaccurate, the consequences can be even more severe. It's akin to risking money on a lottery ticket, believing it will be a winner.
Our methodology is different, and it may ensure longevity in the financial markets. The structure remains crucial, but it is not the sole foundation of everything; instead, it serves as a validation tool. Each calculation, such as order blocks (OB), Fair Value Gaps (FVG), liquidity grabs (LG), range analysis, and more, is independent and unique, separate from the structure. However, validation must ultimately come from the structure itself.
We employ individual and high-quality filters: before a function calculation is validated by the structure, it must undergo rigorous testing based on its own set of validation conditions. This approach aims to enhance robustness and accuracy, providing traders with a reliable framework for making informed trading decisions.
▸ An example of structure validation: Order Block with "Swing Sensitivity"
These order blocks will only be displayed and utilized by the script if there is a swing structure validation with a valid break. In other words, the presence of a confirmed swing Change of Character (ChoCh) or Break of Structure (BoS) is essential for the Order Block to be considered valid and relevant.
This approach ensures that the order blocks are aligned with the overall market structure and are not based on isolated or unreliable price movements. Whether it's Fair Value Gaps (FVG), Liquidity Grabs (LG), Range calculations, or other functionalities, the same underlying principle holds true. The background structure calculation serves as a validation mechanism for the data and insights generated by these functions, ensuring they adhere to the specific criteria and rules established within our methodology. By incorporating this robust validation process, traders can have confidence in the reliability and accuracy of the information provided by the indicator, allowing them to make informed trading decisions based on validated data and analysis.
══════════════════
👉 Usage - the general approach
Determine your trading style and build your basic strategy:
The indicator helps you understand your trading style, whether it's swing trading, scalping or another approach. By analyzing the SMC indicator, you gain valuable information about potential market trends, entry and exit points, and overall market sentiment.
Steps:
Identify Trading Style: Determine whether you are a swing trader, scalper, or long-term investor. This will influence how you use the indicator.
Analyze Market Trends: Use the SMC indicator to observe market trends and identify potential entry and exit points.
Adapt Strategies: Adjust your strategies based on the market dynamics revealed by the SMC indicator, such as changes in order flow or market structure.
👉 Example of usage
In the following chart, you'll notice how we've utilized the indicator to formulate a strategic trading approach. We've employed Order Blocks equipped with volume parameters to identify crucial market zones. Simultaneously, we've leveraged swing/internal market structures to gain insights into potential long- and short-term market turnarounds. Lastly, we've examined trend line liquidity zones to pinpoint probable impulses and breakouts within ongoing trends.
Now we can see how the price descended to the order block with the highest volume, which we had previously marked as our point of interest for an entry. As the price closed below the median Order Block, we noted its mitigation. After an internal CHoCH, it's directing us towards the main Order Block as a target.
══════════════════
🧠 General advice
Trading effectively requires a range of techniques, experience, and expertise. From technical analysis to market fundamentals, traders must navigate multiple factors, including market sentiment and economic conditions. However, traders often find themselves overwhelmed by market noise, making it challenging to filter out distractions and make informed decisions. By integrating multiple analytical approaches, traders can tailor their strategies to fit their unique trading styles and objectives.
Confirming signals with other indicators
As with all technical indicators, it is important to confirm potential signals with other analytical tools, such as support and resistance levels, as well as indicators like RSI, MACD, and volume. This helps increase the probability of a successful trade.
Use proper risk management
When using this or any other indicator, it is crucial to have proper risk management in place. Consider implementing stop-loss levels and thoughtful position sizing.
Combining with other technical indicators
Integrate this indicator with other technical indicators to develop a comprehensive trading strategy and provide additional confirmation.
Conduct Thorough Research and Backtesting
Ensure a solid understanding of the indicator and its behavior through thorough research and backtesting before making trading decisions. Consider incorporating fundamental analysis and market sentiment into your trading approach.
══════════════════
⭐ Conclusion
We hold the view that the true path to success is the synergy between the trader and the tool, contrary to the common belief that the tool itself is the sole determinant of profitability. The actual scenario is more nuanced than such an oversimplification. A word to the wise is enough: developed by traders, for traders — pioneering innovations for the modern era.
Risk Notice
Everything provided by algoat — from scripts, tools, and articles to educational materials — is intended solely for educational and informational purposes. Past performance does not assure future returns.